mirror of
https://github.com/verymeticulous/wikAPEdia.git
synced 2025-06-13 13:07:56 -05:00
Compare commits
90 Commits
| Author | SHA1 | Date | |
|---|---|---|---|
| 12d2c144ea | |||
| 8e55413e7b | |||
| a78c1641b4 | |||
| 794abc0db2 | |||
| 8fdd8da215 | |||
| ec4606bce4 | |||
| adce416a9f | |||
| ff6a28a52d | |||
| fc35d6297b | |||
| 2725d73cc9 | |||
| 705ecc97bf | |||
| 8f09b55ec9 | |||
| a49483bad6 | |||
| e2a9631da6 | |||
| 1c7d9a361c | |||
| f04be5cc00 | |||
| 90e9607300 | |||
| d377b209eb | |||
| 515ce1f690 | |||
| fc9a3b0944 | |||
| e7962edba2 | |||
| f9190405f2 | |||
| 06832ca063 | |||
| 025b634dbf | |||
| 88c5feaa46 | |||
| b59e5faa93 | |||
| d879ee2060 | |||
| 99798a6273 | |||
| 248449ca9f | |||
| 02c95a2530 | |||
| f9cbe27532 | |||
| 474f397f79 | |||
| 44b8e728fb | |||
| da12062e7b | |||
| da8d0ad718 | |||
| 8ef1efccd9 | |||
| e964ce833f | |||
| eb7ee0db01 | |||
| 53a33ce965 | |||
| 08d3a097d9 | |||
| 94cfe89a43 | |||
| 11fe71b554 | |||
| 2f15f08d46 | |||
| 3aa8d54602 | |||
| b6933c2291 | |||
| 79322ec24c | |||
| 6950af5b40 | |||
| a01646471b | |||
| 0cd4576c6d | |||
| 6ab892d32f | |||
| 3937ae59cb | |||
| 4b27b6204b | |||
| 4a331b6c52 | |||
| 2f30f4bc53 | |||
| c09773f509 | |||
| cc2fb5ded8 | |||
| c337ba8785 | |||
| 76b386cf99 | |||
| a947df0dea | |||
| 6d6060ad55 | |||
| 85f04ef0ea | |||
| 25b62dd161 | |||
| cfc6ad77e1 | |||
| af065fe56c | |||
| 762952b9ef | |||
| 61e25c2883 | |||
| 12311041d6 | |||
| dd852a6493 | |||
| 79e4e0cd16 | |||
| d69645a350 | |||
| aac68d33a6 | |||
| 8408856cd3 | |||
| 9ef92f61a6 | |||
| 4d474514f4 | |||
| 101785a975 | |||
| 14aa3bea62 | |||
| 86bf83b998 | |||
| 54c7009ec1 | |||
| accb3aefce | |||
| e8acbcf50f | |||
| c250968124 | |||
| 5088387b03 | |||
| e195c32b75 | |||
| 541e06f2e4 | |||
| 98e00b8a99 | |||
| 1406e8d707 | |||
| f2586a988e | |||
| d1897a213d | |||
| 2e43c872af | |||
| 1ba793a292 |
@ -0,0 +1,13 @@
|
||||
For new Apes: This is what happened yesterday
|
||||
=============================================
|
||||
|
||||
| Author | Source |
|
||||
| :-------------: |:-------------:|
|
||||
| [u/derAres](https://www.reddit.com/user/derAres/) | [Reddit](https://www.reddit.com/r/Superstonk/comments/og5llh/for_new_apes_this_is_what_happened_yesterday/) |
|
||||
|
||||
---
|
||||
|
||||
|
||||
[HODL 💎🙌](https://www.reddit.com/r/Superstonk/search?q=flair_name%3A%22HODL%20%F0%9F%92%8E%F0%9F%99%8C%22&restrict_sr=1)
|
||||
|
||||

|
||||
@ -0,0 +1,9 @@
|
||||
# I Am Not a Financial Advisor PDF
|
||||
|
||||
| Author | Source |
|
||||
| :-------------: |:-------------:|
|
||||
| [@iamnotafinadv](https://www.twitter.com/iamnotafinadv) | [Source](https://iamnotafinancialadvisor.com/) |
|
||||
|
||||
---
|
||||
|
||||
[GMEv14.zip](https://github.com/verymeticulous/wikAPEdia/files/6764891/GMEv14.zip)
|
||||
@ -1,5 +1,8 @@
|
||||
# Resources
|
||||
|
||||
| Last Updated | July 7, 2021 |
|
||||
| :---: | :---: |
|
||||
|
||||
| Name | Description |
|
||||
| :---: | :---: |
|
||||
| [GameStop Newsroom](https://gamestop.gcs-web.com/news-releases-0) | Stay up to date with GameStop's latest strategic initiatives. |
|
||||
@ -34,6 +37,8 @@
|
||||
| [US House of Representatives Stock Watcher](https://housestockwatcher.com/) | Website created by [u/rambat1994](https://www.reddit.com/u/rambat1994/) that tracks stock trades of US House of Representatives. |
|
||||
| [Investor.gov - Researching Investments](https://www.investor.gov/introduction-investing/getting-started/researching-investments) | Website that you walks you through how to do your due diligence. |
|
||||
| [Tax My Tendies](https://taxmytendies.com/) | Tools that helps you calculate how much you'll owe in taxes post-MOASS. (US only). |
|
||||
| [Gamestop NFT](https://nft.gamestop.com/) | GameStops' official NFT website |
|
||||
| [GME NFT Relationships](https://github.com/schismsaints/GME_NFT) | Graphic that shows the relationships between GME tokens. |
|
||||
|
||||
*Table inspired by [u/Truffluscious](https://www.reddit.com/user/Truffluscious/)*
|
||||
|
||||
|
||||
@ -0,0 +1,60 @@
|
||||
RC's tweets are timed with ETF FTDs
|
||||
===================================
|
||||
|
||||
| Author | Source |
|
||||
| :-------------: |:-------------:|
|
||||
| [u/dentisttft](https://www.reddit.com/user/dentisttft/) | [Reddit](https://www.reddit.com/r/Superstonk/comments/oeahh2/rcs_tweets_are_timed_with_etf_ftds/) |
|
||||
|
||||
---
|
||||
|
||||
[Possible DD 👨🔬](https://www.reddit.com/r/Superstonk/search?q=flair_name%3A%22Possible%20DD%20%F0%9F%91%A8%E2%80%8D%F0%9F%94%AC%22&restrict_sr=1)
|
||||
|
||||
*This post is for education purposes only. Not financial advice.*
|
||||
|
||||
TL;DR: RC's tweets happen on days where large amounts of ETF FTDs are covered/delayed.
|
||||
|
||||
Hi everyone,
|
||||
|
||||
I've been diving into ETF FTDs for a while now and something finally clicked. *Almost every RC tweet happens on the same day a large amount of ETF FTDs are "cleared".* ETF FTDs are allowed to stack up for 3 days before needing to be handled. So when a specific ETF stacks up a decent chunk of FTD, puts are opened to delay 34 days, then RC tweets.
|
||||
|
||||
To show what I mean, I weighted the ETF FTDs by GME's weight within the ETF. GME is in a lot of ETFs, but these are the ETFs with significant enough FTDs: IWM, XRT, XSVM, FTXD, BUZZ, XSMO, IWC, FNDX, IJR, SPSM, SFYF, PSCD, SLYV, VXF, IJT, GINN, and VB.
|
||||
|
||||
Below is a heatmap of those ETFs. Each ETF is a different row, each trading day is a different column. The green color shows where a lot of FTDs are. The darker the green, the more ETFs. The blue marks a day where RC tweeted. If you look at a blue column and track it down, there is an ETF or two that had just cleared their stacked FTDs from the day earlier.
|
||||
|
||||
[](https://preview.redd.it/q7fwa3kn1f971.png?width=1714&format=png&auto=webp&s=a82cf29f39b7996f3de3e34460ba6f615120d3e7)
|
||||
|
||||
Tweets come the day FTDs are cleared - EDIT: outside of the fist emoji (DFV), flag (35 days before memorial day which had GME FTDS), job posting (35 days before June 2 runup), and one of the south park GIFs
|
||||
|
||||
I have an old post from May that claims the Ted tweets are referencing Rule 204: Close-out requirements, the rule the that specifies the thirty-five day cover period.
|
||||
|
||||
[RC Tweet Analysis: Part 1 [The Ted Tweets]](https://www.reddit.com/r/Superstonk/comments/niui83/rc_tweet_analysis_part_1_the_ted_tweets/)
|
||||
|
||||
So using [my T+35 theory](https://www.reddit.com/r/Superstonk/comments/o155a6/t35_is_the_one_true_cycle_evidence_to_back_my/), I marked every trading day that came 35 calendar days after a tweet on the 4H chart. You'll see that most tweets end up corresponding to a jump in GME's price. Gray lines are tweets, green lines are 35 days after a tweet.
|
||||
|
||||
[](https://preview.redd.it/ngufchm54f971.png?width=1307&format=png&auto=webp&s=57ee666bc94c2f54ab09d22e72726e46178964bb)
|
||||
|
||||
GME 4H chart with new tweets marked in gray and T+35 of tweets marked in green.
|
||||
|
||||
Not every tweet corresponds to a jump, but a lot do. The last few tweet's T+35 jump during after hours/premarket after the 35th day because technically they can be covered before 9:30 AM EST on the following day. Notice how a new tweet ends up being very close to the T+35 of an old tweet? To me this visually shows the process of kicking the can down the road. GME is getting suppressed pretty hard so let's mark 35 days after a tweet on SPY. You'll notice green days more consistently on SPY.
|
||||
|
||||
[](https://preview.redd.it/ycd7osw34f971.png?width=1305&format=png&auto=webp&s=fa0047eb004c9c3ed00aed02493a7c785433135a)
|
||||
|
||||
SPY 4H chart with T+35 of tweets marked in green.
|
||||
|
||||
Why is that? Because if a lot of ETF FTDs are being covered on these days, then a lot of underlying stock are being bought to return the ETFs. If a lot of underlying stock rises in value, SPY should rise in value too. GME is being shorted on these days, so it doesn't move much. But they can't short the entire market. I believe the sheer number of ETF FTDs needing to be covered every week is leading to the market inflation that has been seen for the past few months.
|
||||
|
||||
What does this mean for the future?
|
||||
|
||||
I've highlighted days where I expect upward GME movement. But since GME is being held down so much lately, I would expect more upward movement from SPY.
|
||||
|
||||
[](https://preview.redd.it/2u5qd8n53f971.png?width=1390&format=png&auto=webp&s=592a6eb2bd74c64efbae25ad3a5100789307701b)
|
||||
|
||||
Red boxes on dates of T+35 from ETF FTDs.
|
||||
|
||||
That's all I got for today. I'm planning on dropping the ETF FTD DD tomorrow morning. It will go more in depth about the details surrounding this.
|
||||
|
||||
pce~~
|
||||
|
||||
- [u/dentisttft](https://www.reddit.com/u/dentisttft/)
|
||||
|
||||
PS. I made a twitter: <https://twitter.com/dentisttft>
|
||||
@ -0,0 +1,74 @@
|
||||
Citadel has hostages: explaining why the MOASS is taking so long, how the January spike was stopped, Robinhood's motives for the trading halt, and the mysterious silence of the SEC
|
||||
====================================================================================================================================================================================
|
||||
|
||||
| Author | Source |
|
||||
| :-------------: |:-------------:|
|
||||
| [u/Bladeace](https://www.reddit.com/user/Bladeace/) | [Reddit](https://www.reddit.com/r/Superstonk/comments/ofdhkk/citadel_has_hostages_explaining_why_the_moass_is/) |
|
||||
|
||||
---
|
||||
|
||||
[DD 👨🔬](https://www.reddit.com/r/Superstonk/search?q=flair_name%3A%22DD%20%F0%9F%91%A8%E2%80%8D%F0%9F%94%AC%22&restrict_sr=1)
|
||||
|
||||
TA;DR: The January MOASS is delayed because Citadel took hostages. They figured out how to ensure that others would be squeezed before they were. January 28th is the day Robinhood was required to deliver some of the GME shares Citadel owed to its customers, so they halted trading. They halted trading because their relationship with Citadel turned them into a hostage. The MOASS waits until new regulations ensure the hostages are safe...
|
||||
|
||||
TL;DR: Citadel wasn't going to be squeezed in January, Robinhood was. Citadel took hostages and figured out how to ensure that others were squeezed before they were. Robinhood halted trading after GME was on the threshold list for 35 days. After 35 days of failures to deliver, a broker becomes responsible for delivering the security to their customer. The MOASS is taking so long because Citadel managed to figure out how to make their short position other people's problem. This is why Citadel seems to have so many people protecting it and willing to lie for it: they've spent six months figuring out how to ensure it's actually Citadel that gets squeezed. This is why there is an unusual cooperation between parties we wouldn't expect to be able to keep this secret for this long. Not even the SEC can address this directly, Citadel figured out how to take everyone hostage. The past six months have been a negotiation to figure out how to deliver our tendies.
|
||||
|
||||
Theory: Robinhood halted trading the day they became liable for delivery of the GME shares Citadel sold to their customers
|
||||
|
||||
I think Robinhood halted trading because they were required to purchase GME shares to deliver their customers' past orders. Look at this requirement from [SHO § 242.203 (b2)](https://www.law.cornell.edu/cfr/text/17/242.203):
|
||||
|
||||
[](https://preview.redd.it/el9inu75kq971.png?width=1066&format=png&auto=webp&s=950d9158e1ede602b68c834ec9da9552e464e3a3)
|
||||
|
||||
If a Robinhood customer buys shares that are cleared by Citadel Securities, their delivery is not a problem for Robinhood *unless it takes longer than 35 days*. Once a security has taken longer than 35 days to be delivered, Robinhood is responsible for delivering it to their customer. Citadel still has to deliver the security too, but they deliver to Robinhood. So, the chain of obligation goes like this:
|
||||
|
||||
1. Your broker/dealer owes you the security they sold you
|
||||
|
||||
2. The market maker owes your broker the security they sold to the broker
|
||||
|
||||
3. The seller of the security owes the market maker the security they sold to the market maker
|
||||
|
||||
The key point is that *your broker is the one who owes you the shares you buy.* If someone else fails to deliver those shares, it's your broker's problem (although they have some ability to make this into your problem, there were too many GME shares owed to avoid their SHO obligations).
|
||||
|
||||
*(Expanded explanation, boring - you should skip)*
|
||||
|
||||
So, if I want to sell a share on the market (strictly hypothetical, I've never actually tried selling), then I do not owe the sold share directly to the buyer of that share. I send my sell order into the market via my broker and they send that off to the market center where the order is executed by a market maker. I sell my share to the market maker executing the trade. The market maker then sells that share to the broker of whichever ape has brought it and the broker then sells that share to the buyer. Assuming this goes smoothly, my share ends up in the account of the buyer. However, technically speaking, I do not owe the security to the buyer. I owe the security to the market maker, who owes it to the broker, who owes it to the buyer. So, if something goes wrong, and I fail to deliver that share, I have not defaulted on my sale to the buyer, I have defaulted on my sale to the market maker executing the trade. That market maker still owes the share to the buyer's broker, regardless of my failure.
|
||||
|
||||
*(End of skippable content)*
|
||||
|
||||
I suspect that Citadel had been failing to deliver GME shares to Robinhood for an extended period, which is why Robinhood halted buying. Their primary motive was not to help Citadel, but to protect themselves *from* Citadel. After 35 days of failure, Robinhood has to buy the shares they expected Citadel to deliver for their customers. Effectively, due to Citadel's failures to deliver, Robinhood had inherited Citadel's short position. Citadel owed Robinhood and Robinhood owed their customers. I should clarify that, in this scenario, Citadel still owes Robinhood the shares at some point, but Robinhood has to deliver them to their customers *now*. At first, Robinhood didn't care that Citadel owed shares to their customers, until it went on for too long and Robinhood was on the hook to deliver.
|
||||
|
||||
Proof: the timing lines up
|
||||
|
||||
For this to be true, you would expect there to be a relationship between when Robinhood halted trading and the 35 day threshold. If you look at my recent [post on the relationship between the threshold security list and the January price spike](https://www.reddit.com/r/Superstonk/comments/oao9oo/the_nyse_threshold_list_collapsing_shorts_and/?utm_source=share&utm_medium=web2x&context=3) you'll see that GME was on the threshold list for 39 consecutive settlement days, from early December to early February. Robinhood halted trading on January 28, which is *day 35* of this 39 day streak. The trading halt aligns with when the obligation for Robinhood to deliver kicks in. As soon as the undelivered shares became Robinhood's problem, trading was halted. Frankly, I would have expected them to halt trading earlier than the final moment, day 35, but perhaps waiting until the last moment will allow them some legal defense in the court cases to come?
|
||||
|
||||
Proof: the weird cost basis after transfer
|
||||
|
||||
A number of users pointed out that their [purchase prices and dates were incorrectly reported when transferring from Robinhood to other brokers](https://www.reddit.com/r/Superstonk/comments/ncezct/so_robinhood_finally_sent_over_my_cost_basis_from/?utm_source=share&utm_medium=web2x&context=3). I suspect this is because Robinhood initially sold their users the shares based on delivery promises made by Citadel that Citadel then failed to fulfil. So, after 35 days, Robinhood had to fulfil them instead. My guess is that this process was an absolute mess because it required Robinhood to at least appear to be purchasing GME shares from someone *other* than Citadel, which is rather awkward when Citadel is a designated market maker for GME on all major exchanges. The transaction dates and prices are wrong because the trade that was eventually settled for your GME shares *was not the same trade you sent to your broker* - that trade failed and Robinhood had to redo it after 35+ days.
|
||||
|
||||
This might help explain why [my analysis of the 605 data](https://www.reddit.com/r/Superstonk/comments/nc1h4o/findings_from_my_analysis_of_605_data_huge_short/?utm_source=share&utm_medium=web2x&context=3) found that the proportion of GME order executions done through NASDAQ spikes in February, despite being almost non-existent prior to Feb 2021. If Robinhood needs to buy-up GME without going *directly* through Citadel, they'll need to get inventive and perhaps even use over the counter purchases. So, go to a market center that has very little history of executing GME orders - NASDAQ. It's possible that Robinhood borrowed/brought GME from a variety of places to cover for the clusterfuck Citadel dumped them with, and then allocated those GME shares that actually got delivered to customers that transferred. If you had a massive shambles of shares like this, it might manifest in an inaccurate and messy purchase history for your customers.
|
||||
|
||||
Proof: others halted trading too
|
||||
|
||||
Robinhood wasn't the only one that halted trading. It's difficult, but not impossible, for Citadel to have orchestrated this behind the scenes. It's much easier to explain this seemingly organized trading halt by pointing out that the brokers who halted trading *only halted trading when they themselves became obligated to deliver the shares in question.* This is why they halted trading *after* the price had already been spiking - my guess is that Citadel was putting on pressure behind the scenes too, but I don't think it's a coincidence that trading didn't actually halt until the time arrived that the brokers themselves were threatened with delivery obligations.
|
||||
|
||||
Context and discussion: saving Citadel
|
||||
|
||||
Notice that my theory does not do Robinhood any favors - this is not a defense of them or their actions. I suspect, as was claimed during the congressional hearings, the trading halt was the main reason the January spike ended. If my theory is correct, it's likely that the ending of the January spike saved Citadel. This claim is nothing new. What I think my theory adds to the discussion is a better explanation of why Robinhood and others did this. Remember, the buying halt was a disaster for Robinhood! They were dragged in front of congress, their reputation is in tatters, and they're bleeding customers. Halting buying was *not* a good play. My guess is that they knew it would be a disaster and did it anyway. I think that this is why they waited right up until day 35 of GME's run on the threshold list - they didn't help Citadel until the only other option was delivering the undeliverable. In January, those who halted trading were slated to be the first victims of the MOASS.
|
||||
|
||||
Further implications: MOASS is so slow because Citadel has hostages
|
||||
|
||||
I suspect that the implications of what almost happened to Robinhood in January are why we're seeing some of the recent regulation changes ('clarifications'). I think that it was *Robinhood and not Citadel that was squeezed in the January spike*. Citadel is a market maker with its own market center, it has privileges and exemptions that make it quite resilient (as we've found out over the past six months). Robinhood does not have the same level of protection from its exposures, once the 35 day settlement mark passed, they had to deliver shares. It was the brokers that needed to buy shares from the 28th onwards: Citadel's failures to deliver were, in the short term at least, the brokers' problem. For all we know, Citadel didn't cover any of the deliveries that finally got GME off the threshold list at the beginning of February and managed to force the brokers to do it for them. If they were willing to abuse the market enough, perhaps via abuse of NASDAQ in February as my previously linked post discusses, Citadel might have even used the brokers need to deliver as a way of *expanding* their short position substantially while 'technically' resolving the failures to deliver (kicking the can down the road to another day). I guess there is no better ally than one who has to pay your debt if you go under...
|
||||
|
||||
So, if my theory is correct, January almost saw Citadel's failures result in *someone else* getting squeezed! Perhaps this is why the trading halt became the focus of the congressional hearings. Maybe this is why the DTCC has focused so many of their new regulations on clarifying what happens if positions need to be forcibly closed. January might have demonstrated that a market center, such as Citadel Securities, could contrive a scenario where they force *someone else to be squeezed by their short position!*
|
||||
|
||||
In [my post examining the February gamma](https://www.reddit.com/r/Superstonk/comments/mvvuhp/feb_2426_failed_launch_attempt_and_proof_the_dtcc/?utm_source=share&utm_medium=web2x&context=3), I argue that the bizarre market activity near the end of February was a failed attempt to begin the MOASS. If my theory that Robinhood, not Citadel, was being forced to deliver in January is correct, I don't think it's any surprise that attempts to begin the MOASS have been prevented since January. The regulations required updating to prevent Citadel from forcing others to be squeezed before they were. If I am correct, Citadel was holding everyone hostage. The embodiment of too big to fail: not just because of the havoc their sudden demise would cause, but because *they wouldn't be squeezed until after the squeezing of all the smaller parties caught in the impossibly convoluted web of failures to deliver and rehypothecation that Citadel shat into the market.* Lots of entities were exposed to the squeeze, and Citadel was setup to be hit last.
|
||||
|
||||
The MOASS can't launch until the hostages are safe. It needs to be Citadel that's squeezed. Otherwise, the squeeze might wreak havoc on the market with no guarantee that the one responsible dies too. There was no choice but to wait. Meanwhile, Citadel is a huge market center with substantial political clout and presence in the regulators themselves. So, setting up the regulations for the MOASS took time. It was urgent, but those involved were regulating against one of their own.
|
||||
|
||||
I think this offers a compelling explanation for what we've been living through over the last six months because it attributes a strong motive to the parties involved to remain silent. Explaining why this debacle has lasted six months is very difficult. It's an absolute disaster and we haven't even heard anything from the SEC. What could justify this level of cooperation to keep lips tight, just to delay the inevitable? Why such slow action as the problem gets bigger? My guess is that Citadel has hostages and it's taking a lot of careful work behind the scenes to figure out how to be sure that Citadel is the one that takes the fall. With everyone's hands tied and the need for secrecy so high, the job takes time.
|
||||
|
||||
As a disgusting parting thought, I should mention that, if I'm right, my theory predicts that those responsible will suffer only minimal punishment. I suspect it's taken six months because they've needed at least some cooperation from Citadel to sort this out. If this is true, my guess is that Citadel spent February trying to get out of their predicament and refused to cooperate with attempts to arrange the MOASS that will kill them. The February gamma might have been other parties preventing Citadel's efforts to make the situation worse and forcing Citadel to come to the negotiating table. During the early months we saw market activity that indicated whales were fighting each other. I think this was Citadel trying to escape their own trap and whales preventing them, knowing it was too dangerous to let Citadel make things worse while it held the system hostage. Notice that this explains why, relatively speaking, the GME activity calmed slightly as this dragged on: Citadel was forced to the negotiating table and has been helping plan and regulate its own destruction. I suspect the payment for this cooperation will be those involved getting off lightly, because the alternative would be to have the MOASS without them releasing the hostages. Unfortunately, if I'm right, we'll see those responsible living in Florida after this is over. Bankrupt and embarrassed, but more comfortable than the plebs.
|
||||
|
||||
Obvious but crucial disclaimer: I am a random on the internet spinning yarns about a conspiracy theory. As I was posting this thread, I decided to literally wear a tinfoil hat. Anyone reading this should understand my tinfoil attire to mean that I am not competent enough to be offering any advice or taken seriously. Readers must carefully examine any claims made here independently and not regard my words as authoritative.
|
||||
|
||||
Thank you to [u/RoutineYesterday267](https://www.reddit.com/u/RoutineYesterday267/) for a post that led to me writing this
|
||||
@ -0,0 +1,57 @@
|
||||
The whole stock market is being propped up by the RRP market and today I got confirmation bias.
|
||||
===============================================================================================
|
||||
|
||||
| Author | Source |
|
||||
| :-------------: |:-------------:|
|
||||
| [u/titaniumoxide202](https://www.reddit.com/user/titaniumoxide202/) | [Reddit](https://www.reddit.com/r/Superstonk/comments/ofr285/the_whole_stock_market_is_being_propped_up_by_the/) |
|
||||
|
||||
---
|
||||
|
||||
|
||||
[Education 👨🏫 | Data 🔢](https://www.reddit.com/r/Superstonk/search?q=flair_name%3A%22Education%20%F0%9F%91%A8%E2%80%8D%F0%9F%8F%AB%20%7C%20Data%20%F0%9F%94%A2%22&restrict_sr=1)
|
||||
|
||||
I saw a wrinkly brained ape's youtube video (sorry I watch so much shit I can't find who made it) on how the dow jones, S&P, prime brokerages and big banks' (including international ones) stocks tank at around 10 am and then suddenly recover because they NEED the RRP market to post more collateral. I didn't believe it until I checked the charts today. These charts look IDENTICAL to each other. The price is not only wrong for GME but the entire global stock market price is wrong too. HOLY. FUCKING. MOLY. JACKED=TITs.
|
||||
|
||||
Edit: <https://www.youtube.com/watch?v=J5J1pW1rVA8> here's the link. Thanks [u/The_Fake_King](https://www.reddit.com/u/The_Fake_King/)
|
||||
|
||||
P.S They aren't even trying to be discrete anymore. They are DESPERATE.
|
||||
|
||||
[](https://preview.redd.it/dy7erkoclu971.png?width=1242&format=png&auto=webp&s=33f90da5abc2f22e292676225f5e7d7ac247114b)
|
||||
|
||||
[](https://preview.redd.it/0ajrqecxku971.png?width=1242&format=png&auto=webp&s=ba15822bc72953300d9ffdb838d12a3915fa197b)
|
||||
|
||||
[](https://preview.redd.it/6jxs7ccxku971.png?width=1242&format=png&auto=webp&s=8e4384605d0fd84000c9de41fb91bf3a644b9293)
|
||||
|
||||
[](https://preview.redd.it/n9dxpn3kku971.png?width=1242&format=png&auto=webp&s=1c98442d7f3487e88f49aa65bc65125be00323da)
|
||||
|
||||
[](https://preview.redd.it/b2y4jz3kku971.png?width=1242&format=png&auto=webp&s=7a214711c089e322f9bbab4d5206dd7588874fff)
|
||||
|
||||
[](https://preview.redd.it/vs1v0t3kku971.png?width=1242&format=png&auto=webp&s=86a56c683e85961d8b485643cfd8657506111405)
|
||||
|
||||
[](https://preview.redd.it/zrnf6m3kku971.png?width=1242&format=png&auto=webp&s=3cf7085790430cc788d36832cf60f3e3d506cae5)
|
||||
|
||||
[](https://preview.redd.it/sbfbnp3kku971.png?width=1242&format=png&auto=webp&s=11958c4e60087c5a90836bbe5b6cb907f85d0143)
|
||||
|
||||
[](https://preview.redd.it/428koz3kku971.png?width=1242&format=png&auto=webp&s=966b2ebec618ca1f77a7c7b6e22d1a92f0df389f)
|
||||
|
||||
[](https://preview.redd.it/34duc34kku971.png?width=1242&format=png&auto=webp&s=87817270edad52fdaa030912dd78df70d589532e)
|
||||
|
||||
[](https://preview.redd.it/hgwpsc4kku971.png?width=1242&format=png&auto=webp&s=69d9e5e346aca7d1eba6def5855a29abeb88dd16)
|
||||
|
||||
[](https://preview.redd.it/9ht1o34kku971.png?width=1242&format=png&auto=webp&s=842bae394de413b9510f5d08c352857a68ef1541)
|
||||
|
||||
[](https://preview.redd.it/i98i0j3kku971.png?width=1242&format=png&auto=webp&s=67caeb722a196092e2a1e67da20527d77e0d05e9)
|
||||
|
||||
[](https://preview.redd.it/6uj8sn3kku971.png?width=1242&format=png&auto=webp&s=7497d256e507fa949de849b9da4dc90adc15d88a)
|
||||
|
||||
[](https://preview.redd.it/e944tz3kku971.png?width=1242&format=png&auto=webp&s=fc4330182481ef3d07d2de1c382118804df8e3d2)
|
||||
|
||||
[](https://preview.redd.it/y4um9l3kku971.png?width=1242&format=png&auto=webp&s=b57870485f4e9a347ed111fb9818a2cd3b31d064)
|
||||
|
||||
[](https://preview.redd.it/xtvl7h3kku971.png?width=1242&format=png&auto=webp&s=7141d752ff4b045c31d55e7a6102f30065e4657d)
|
||||
|
||||
[](https://preview.redd.it/ydb8fm3kku971.png?width=1242&format=png&auto=webp&s=3d0d72944c9e3460130082225467e84bacdb0bcc)
|
||||
|
||||
[](https://preview.redd.it/qwealf3kku971.png?width=750&format=png&auto=webp&s=9d00ae8ae35037eca09ea48368d9e668ac0b336e)
|
||||
|
||||
[](https://preview.redd.it/7fa0xk3kku971.png?width=750&format=png&auto=webp&s=edcc8956475920c1f7a75638e49c5d42cc42594c)
|
||||
@ -0,0 +1,168 @@
|
||||
Theory: ALL THE PIECES, pt. 1 -- The Anatomy of the Crime of Citadel
|
||||
===================================================================
|
||||
|
||||
| Author | Source |
|
||||
| :-------------: |:-------------:|
|
||||
| [u/swede_child_of_mine](https://www.reddit.com/user/swede_child_of_mine/) | [Reddit](https://www.reddit.com/r/Superstonk/comments/mn0q9q/theory_all_the_pieces_pt_1_the_anatomy_of_the/) |
|
||||
|
||||
---
|
||||
|
||||
[DD 👨🔬](https://www.reddit.com/r/Superstonk/search?q=flair_name%3A%22DD%20%F0%9F%91%A8%E2%80%8D%F0%9F%94%AC%22&restrict_sr=1)
|
||||
|
||||
*"Behind every great fortune there is a crime" -- Balzac*
|
||||
|
||||
This post is the collective narrative behind the plays on GME by large institutions. This will be a multi-part DD post gathered from excellent insights on this sub. As there have been no open confessions of these activities by the perpetrators (a la Bernie Madoff), or books that have yet been written, this will only exist as a theory with pieces of evidence to support where we can. It is designed to be high-level, approachable, supported by available sources where possible, and represent key players and interests as it relates to the events surrounding GME. It is incomplete. Where information cannot be confirmed, it will be marked as rumor or speculation and should be treated as such, but it should not be a rabbit-hole. It will be ongoing and require updating as well as contributions from you, outlined below:
|
||||
|
||||
- [] - request for link to relevant DD (DD posts or legitimate sources)
|
||||
|
||||
- /e?/ - expert insight requested (e.g. legal review -- I'll try to call out specific users that are known for their specialties on this sub)
|
||||
|
||||
- /R/ - further research requested
|
||||
|
||||
(Setting expectations for the veteran readers of [r/GME](https://www.reddit.com/r/GME/) and [r/SuperStonk](https://www.reddit.com/r/SuperStonk/): you will already be familiar with many of the terms, events, and points described in this first post. However, even if it is already familiar to you, I hope this post will still be a valuable summary and an easy introduction for anyone who wants to know more about the stock. Please feel free to contribute sources you might see are missing)
|
||||
|
||||
* * * * *
|
||||
|
||||
Part 1: The Crime of Citadel
|
||||
|
||||
$GME
|
||||
|
||||
The current price of GameStop stock is artificial. In simpler terms, the price of $GME is not determined by normal market dynamics - supply and demand. This is because Citadel and others have been illegally manufacturing fraudulent shares of GME, abusing their special designation as Market Maker to profit their firms. The more straightforward term for their activity is *share counterfeiting*. Citadel & others have been counterfeiting shares of GME, profiting from non-existent shares, dumping fraudulent stock to lower the price, and abusing system lapses to hide their activities. Their scheme that has grown wildly out of hand and now threatens to wipe out many more firms in the market due to their risky behaviors.
|
||||
|
||||
An overview of the mechanics of this scheme:
|
||||
|
||||
FTD (for Failure To Deliver) -- a key term to understand
|
||||
|
||||
1\. FTD is a standardized term for a delay in delivering a share that's been purchased. *In the context of Citadel, an FTD represents a counterfeit share.*
|
||||
|
||||
- In the US market, a share can be sold regardless of whether or not it actually exists. The financial system accepts the transaction at face value so that the buyer can continue trading.
|
||||
|
||||
- The delay in delivering a share is meant to be temporary...
|
||||
|
||||
- ...but for Citadel's case, they never had the share they sold; they abused their position to "sell" something they didn't have.
|
||||
|
||||
- Outright share counterfeiting is highly illegal, and one of the financial crimes that [carries prison sentences](https://www.criminaldefenselawyer.com/crime-penalties/federal/Securities-Fraud.htm)
|
||||
|
||||
- For Citadel to perpetrate this crime, they needed to hide it among their transactions and appear legitimate (FTD's can be legitimate, and enforcement is subjective "[*...will depend on the facts and circumstances of the particular activity*](https://www.sec.gov/divisions/marketreg/mrfaqregsho1204.htm)")
|
||||
|
||||
Citadel's Scheme, Part 1: Create a Share, Legitimately
|
||||
|
||||
1\. [Citadel](https://en.wikipedia.org/wiki/Citadel_LLC)'s activities are recognized as a ["bona-fide" Market Maker](https://www.mmlawus.com/newsitem/alerts/larry-bergmann-addresses-regulation-sho-and-bona-fide-market-making/), an industry designation which allows them special authorities and responsibilities.
|
||||
|
||||
- One of their special authorities is to "create" shares in the marketplace as part of their role of providing liquidity. ("Liquidity" is finance speak for -- "keeping the shelves full with the stocks people want")
|
||||
|
||||
- Citadel is allowed to execute transactions without owning the share -- i.e. Market Makers can temporarily "create" a share from nothing -- with the understanding that it is illegal to manufacture shares for their own profit.
|
||||
|
||||
- This "temporarily created share" is recorded as a "short": designed to be sold to the marketplace then bought back within a brief period of time, to prevent an enduring non-existent share in the marketplace.
|
||||
|
||||
- "Shorting" is also a common practice of borrowing a share from someone else's account. The borrowed share is sold into the marketplace, and ideally bought back at a lower price and returned to the account (many financial companies do this legally, Citadel included).
|
||||
|
||||
- Both traditional shorting and "bona-fide" market maker shorting creates a "legitimate" non-existent share -- temporarily. Again, the non-existent share is meant to be a placeholder until a real share is delivered.
|
||||
|
||||
- If the share is out in the marketplace long enough without being repurchased, the share is flagged as an FTD -- failure to deliver -- since there was no *actual* share delivered. If it is never reconciled, it becomes counterfeit.
|
||||
|
||||
Citadel's Scheme, Part 2: It's Only Illegal If You Get Caught
|
||||
|
||||
1\. The process of determining an FTD is technically complex. There are regulations for the amount of days which need to pass [before a share is declared an FTD](https://www.sec.gov/investor/pubs/regsho.htm).
|
||||
|
||||
- Additionally, *AFTER* a share is delcared an FTD, there are additional times allowed for counterfeit shares to to be rebought, with even more time allotted for Market Makers to do so.
|
||||
|
||||
- But once the allotted time passes and the delivery is still failed, the party at fault is subject to enforcement measures.
|
||||
|
||||
- The enforcement measures are weak -- [small fines levvied far after the violation](https://financefeeds.com/citadel-securities-fined-275k-reporting-violations-700k-fine-2020/) (generally for less than the profit made from the activities)...
|
||||
|
||||
- ...and it is difficult to track. Individual shares may trade dozens or hundreds of times per day, and there is no way to follow the path -- or origin -- of each individual share.
|
||||
|
||||
- So the "counterfeit" share is logged against the overall pool of shares, not knowing which particular one is non-existent. But the contracts for the sale remains on the books of the parties involved.
|
||||
|
||||
- And while enforcement agencies are not interested in small volumes of counterfeit shares or low cost shares, Citadel has been manufacturing millions of fraduluent shares at a price of hundreds of dollars each, getting away with it under the guise of "bona-fide" Market Maker activities that have yet to be settled.
|
||||
|
||||
- However, any company with a "short" position on their books will retain the debt of the counterfeit share for the duration it is on the market...
|
||||
|
||||
Citadel's Scheme, Part 3: Take the Money...
|
||||
|
||||
1\. Once the counterfeit share is sold and becomes an FTD, there are several options for addressing the FTD.
|
||||
|
||||
- Buying a share in the marketplace is the primary way of closing out an FTD. This also closes out the "short" position that is on the seller's books.
|
||||
|
||||
- A second way to close an FTD is when the price of the stock goes to $0, and the stock gets de-listed. This voids *all* of that company's stock, including the fraudulent shares. [] The FTD problem simply goes away with all of the other stock.
|
||||
|
||||
- For a party engaged in the criminal act of counterfeiting shares, their main interest is in avoiding consequences of FTDs - not getting caught. They intend to sell shares they never have and never pay for them.
|
||||
|
||||
- Paying for shares from the marketplace is undesirable to Citadel, not only because it increases costs ("the cost of legitimacy"), but also because the price of shares could go up and make the transaction a loss.
|
||||
|
||||
- Flooding the market with shares also has the added effect of dropping the price of the stock, because the market is overwhelmed with supply...
|
||||
|
||||
- ...and if the price goes so low that the stock gets de-listed, the "debt" of the shares on the seller's books becomes a writeoff, which they will enjoy a tax benefit from [].
|
||||
|
||||
- So bankrupting copmanies is the most desirable outcome from share counterfeiters. The targeted company is an unfortunate casualty, chosen for its ability to be shorted into bankruptcy.
|
||||
|
||||
- This is the first part of Citadel's scheme: target a company, flood the market with counterfeit shares, drop the price of the stock to $0, walk away with the profits from the counterfeit shares, and enjoy the tax writeoff.
|
||||
|
||||
- Note: Short positions are not publicly disclosed, and a company's banruptcy closes all positions, so tracing these activities to Citadel is extremely difficult. These activites can happen entirely behind closed doors and leave little evidence in the public marketplace. That is what this sub has been working with: trace evidence of counterfeiting activities in the marketplace.
|
||||
|
||||
Citadel's Scheme, Part 4: ...and Run
|
||||
|
||||
1\. Profitably closing an FTD (either via bankrupcy or repurchase) requires one thing: the price of the target stock to go down.
|
||||
|
||||
- In this case, the $GME stock price went up during their scheme.
|
||||
|
||||
- This caused Citadel to find an alternative to closing the FTDs. So perhaps as a temporary stop-gap, or perhaps as a last resort, Citadel chose to perpetuate FTDs without closing them - they would keep the FTDs ongoing as long as they could, never getting caught, until circumstances let them exit their position. Hiding until they escape.
|
||||
|
||||
- Since FTDs are reported by *time*, Citadel figured they could reset the "timer" to avoid getting caught (very similar to floating credit card payments). They could do this two ways:
|
||||
|
||||
- First, they could short the traditional way -- borrow or acquire a batch of the shares from an exchange or *dark pool* (an off-exchange trading room), and then turn around and close their FTDs. Those new shorts would later become new FTDs, but it would give them a few days.
|
||||
|
||||
- Second, they could counterfeit additional shares. While it is uncertain if it was possible for Citadel to use counterfeit shares to close out FTDs [], their releasing more counterfeited shares into the marketplace let them easily borrow or buy the shares back, then turn around and close out the FTDs. Again, shorting gives a few more days until thes counterfeit shares became FTDs.
|
||||
|
||||
- Citadel could reset FTDs like this continuously, never running into the enforcement limits without being able to reset the FTD timer again.
|
||||
|
||||
- This would also keep the marketplace full of shares - normally a desirable outcome. But in the interest of their counterfeiting scheme, keeping an abundant supply of shares in the marketplace also keeps the stock price low, the availability of additional borrows high, and the interest on the borrowed shares low.
|
||||
|
||||
- And if Citadel was worried about availability, they could also re-borrow the share they just sold (i.e. borrow from A, sell to C, then borrow the same share from C -- a process known as "rehypothecation") -- a legal practice.
|
||||
|
||||
Citadel's Scheme, Part 5: But at what cost?
|
||||
|
||||
1\. The cost of resetting the FTD timetable -- "kicking it down the road" -- is twofold:
|
||||
|
||||
- First, there is a daily interest paid on every shorted share Citadel has. The interest rate is decided by the lending organization, and is related to the price and availability of the share to be borrowed. []
|
||||
|
||||
- Second, for every short Citadel left open, the debt of that share remains on their books. As Citadel shorts more shares and as the price of the shares went up, their overall debt increases. If the debt gets too large, Citadel would potentially be "margin called" -- their debtors would force Citadel to pay up. [courtesy: [u/atobitt](https://www.reddit.com/u/atobitt/) - [Image of Citadel's 2020 "securities sold but not yet purchased"](https://preview.redd.it/83uepbgudqm61.png?width=829&format=png&auto=webp&s=7c8b1f1475be0cf61d55f87e29fd282c45833b3c)]
|
||||
|
||||
- It is unknown when or how large their debt must be before Citadel is margin called.[]
|
||||
|
||||
- Additionally, due to Citadel's activities it is difficult to know what a *legitimate* short term debt is on their books, from their legitimate activities, or what a fraudulent debt is from their counterfeiting activities.
|
||||
|
||||
- But by using a legitimate function to hide their scheme, they can achieve the illegal results -- selling shares which they don't have and never intend to deliver.
|
||||
|
||||
- Citadel's activities also pose an extreme cost to the system. Fraudulent shares circulating in the marketplace means investors may become unsure that their shares are legitimate. Or investors may become unsure that the price of the stock is a reflection of legitimate supply and demand, but is instead artificial -- lowered because of a surplus of fake shares.
|
||||
|
||||
* * * * *
|
||||
|
||||
Addtional reading: [u/atobitt](https://www.reddit.com/u/atobitt/) 's - ["Citadel has no clothes"](https://www.reddit.com/r/GME/comments/m4c0p4/citadel_has_no_clothes/)
|
||||
|
||||
[u/canhazreddit](https://www.reddit.com/u/canhazreddit/) 's - ["It's painfully obvious that when GME has a ton of FTDS, they're immediately reversing them with their hedgefuckery."](https://www.reddit.com/r/GME/comments/mijfq9/its_painfully_obvious_that_when_gme_has_a_ton_of/)
|
||||
|
||||
* * * * *
|
||||
|
||||
TL; DR & Summary: Citadel has been perpetrating a crime -- illegally counterfeiting shares into the marketplace in order to profit. They are selling shares they don't have and never intended to deliver. Citadel has been using their designation as a Market Maker to cover their activities as well as continue to counterfeit shares. This poses an increasing risk to their own business and moreso the overall market.
|
||||
|
||||
Edit: [u/Vipper_of_Vip99](https://www.reddit.com/u/Vipper_of_Vip99/) smartly recommended updating the bullets to numbers.
|
||||
|
||||
* * * * *
|
||||
|
||||
Final note: here is an excerpt on Bernie Madoff from the [Madoff Investment Scandal wiki](https://en.wikipedia.org/wiki/Madoff_investment_scandal):
|
||||
|
||||
> At one point, Madoff Securities was the largest buying-and-selling "market maker" at the NASDAQ.
|
||||
|
||||
>
|
||||
|
||||
> In 1992, The Wall Street Journal described him:
|
||||
|
||||
>
|
||||
|
||||
> *... one of the masters of the off-exchange "third market" and the bane of the New York Stock Exchange. He has built a highly profitable securities firm, Bernard L. Madoff Investment Securities, which siphons a huge volume of stock trades away from the Big Board. The $740 million average daily volume of trades executed electronically by the Madoff firm off the exchange equals 9% of the New York exchange's. Mr. Madoff's firm can execute trades so quickly and cheaply that it actually pays other brokerage firms a penny a share to execute their customers' orders, --- Randall Smith, Wall Street Journal*
|
||||
|
||||
And here is an excerpt from [Citadel's wiki](https://en.wikipedia.org/wiki/Citadel_LLC#Citadel_Securities):
|
||||
|
||||
> Citadel Securities automation has resulted in more reliable trading at lower costs and with tighter spreads. [...] Citadel Securities is the largest market maker in options in the U.S., executing about 25 percent of U.S.-listed equity options volume. According to the Wall Street Journal, about one-third of stock orders from individual investors is completed through Citadel, which accounts for about 10% of the firm's revenue. Citadel Securities also executes about 13 percent of U.S. consolidated volume in equities and 28 percent of U.S. retail equities volume.
|
||||
@ -0,0 +1,208 @@
|
||||
Theory: ALL THE PIECES, pt. 2 -- The Deep End of the Pool
|
||||
========================================================
|
||||
|
||||
| Author | Source |
|
||||
| :-------------: |:-------------:|
|
||||
| [u/swede_child_of_mine](https://www.reddit.com/user/swede_child_of_mine/) | [Reddit](https://www.reddit.com/r/Superstonk/comments/ms9z0n/theory_all_the_pieces_pt_2_the_deep_end_of_the/) |
|
||||
|
||||
---
|
||||
|
||||
[DD 👨🔬](https://www.reddit.com/r/Superstonk/search?q=flair_name%3A%22DD%20%F0%9F%91%A8%E2%80%8D%F0%9F%94%AC%22&restrict_sr=1)
|
||||
|
||||
[*There was Jimmy, and Tommy, and Me. - Goodfellas*](https://www.youtube.com/watch?v=caCA0rUMR6U)
|
||||
|
||||
This post is the collective narrative behind the plays on GME by large institutions. This will be a multi-part DD post gathered from excellent insights on this sub. As there have been no open confessions of these activities by the perpetrators (a la Bernie Madoff), or books that have yet been written, this will only exist as a theory with pieces of evidence to support where we can. It is designed to be high-level, approachable, supported by available sources where possible, and represent key players and interests as it relates to large players movements in GME. It is incomplete. Where information cannot be confirmed, it will be marked as rumor or speculation and should be treated as such, but it should not be a rabbit-hole. It will be ongoing and require updating as well as contributions from you, outlined below:
|
||||
|
||||
- [] - link to relevant DD requested (DD posts or legitimate sources)
|
||||
|
||||
- \ /e?/ - expert insight requested (e.g. legal review -- I'll try to call out specific users that are known for their specialties on this sub)
|
||||
|
||||
- \ /R/ - further research requested
|
||||
|
||||
(Setting expectations for the veteran readers of [r/GME](https://www.reddit.com/r/GME/) and [r/SuperStonk](https://www.reddit.com/r/SuperStonk/): you will already be familiar with many of the terms, events, and points described in this first post. However, even if it is already familiar to you, I hope this post will still be a valuable summary and an easy introduction for anyone who wants to know more about the stock. Please feel free to contribute sources you might see are missing)
|
||||
|
||||
* * * * *
|
||||
|
||||
Part 2: The Deep End of the Pool
|
||||
|
||||
The price of $GME is artificial. The [previous post](https://www.reddit.com/r/Superstonk/comments/mn0q9q/theory_all_the_pieces_pt_1_the_anatomy_of_the/) covered how Citadel was perpetrating a crime, illegally counterfeiting shares to change the price of GME for profit. It is not alone in this crime. Multiple organizations are coordinating the same illegal activities in a larger scheme. Their illegal enterprise engages in share counterfeiting, price fixing, and conspiracy. Some of their crimes leave public evidence, but some of the activity takes place discreetly in *Dark Pools* - off exchange rooms where trades happen with fewer regulations and less visibility. The end result is that each organization abuses their position to profit in an illegal enterprise which jeopardizes the larger market.
|
||||
|
||||
Key Terms
|
||||
|
||||
1. Market Maker (or "MM") -- a special role in a stock exchanges around the world. An MM's primary role is to provide liquidity, or "to make sure there are shares available to buy if people want them" as well as "make sure there is a buyer if people want to sell." Liquidity makes for easy buying and selling.
|
||||
|
||||
- Liquidity is also important because some companies want their stock price to be related to their company performance (a.k.a. - valuation), and not related to whether or not their shares are available (a.k.a. - scarcity). [More here](https://www.investopedia.com/terms/p/pricediscovery.asp)
|
||||
|
||||
- Since a Market Maker has control over the availability of shares -- which controls the price -- a Market Maker is required to remain "neutral" on its positions. They cannot put pressure on a stock on either the buy side or sell side. If they create a position on one side to meet demand, they must "hedge" on the other side by creating or owning an opposing position. This "neutralizes" their effects on the stock price, but still creates the liquidity.
|
||||
|
||||
- The designers of this framework presumed an honest Market Maker.
|
||||
|
||||
Part 1: Recap -- The Shallow End
|
||||
|
||||
1. Citadel is the largest Market Maker for the NYSE. But Citadel has been using its powers as Market Maker to illegally counterfeit shares for profit.
|
||||
|
||||
- A Market Maker has the authority to temporarily create shares. Citadel has been abusing this to create *perpetual temporary shares* (or "naked shorts") by exploiting a reporting lapse in the system, so the *perpetual temporary shorts* aren't recognized as fraudulent.
|
||||
|
||||
- This is called a *naked short*, because there isn't a share "there", but the system shows it is and the system acts like it is.
|
||||
|
||||
- Citadel naked shorts both for profit and for tactical reasons. Tactically, when Citadel introduces more (counterfeit) shares into a limited supply, they can lower the price of the targeted stock by dilution...
|
||||
|
||||
- ...and if a stock becomes low enough, it gets de-listed. De-listing typically bankrupts the company and circumvents any consequences for the naked shorts. But the counterfeiter still profits -- at the expense of the company they bankrupted.
|
||||
|
||||
- However, with $GME, Citadel found itself unable to counterfeit enough shares to de-list the stock. Failure meant it needs to prevent the large amount of naked shorts from "Failing to Deliver" (or FTD) -- have their status realized as counterfeit by the regulators.
|
||||
|
||||
- Citadel needs to constantly close out and re-open ("refresh") the naked shorts it has flooded the market with, perpetuating the temporary shares.
|
||||
|
||||
- The cost to Citadel is twofold: daily interest on the legitimate shorts, and exposure to being *margin called* -- forced to pay for the fraudulent shares -- should the price of GME go high enough. Citadel is extremely motivated to prevent this from happening.
|
||||
|
||||
Part 2: Marco
|
||||
|
||||
1. Citadel needs to abide by its responsibilities as a Market Maker when it creates a share; it needs to remain "neutral" on its MM positions.
|
||||
|
||||
- Creating a share is a "net short" position for a MM, meaning it creates downward pressure on the stock price. Even if they rent out the share for someone else to short it will still be a *net short* position.
|
||||
|
||||
- For a created share to be a sanctioned MM action, it must paired it with another, opposite position to make the entire action neutral.
|
||||
|
||||
- A MM can offset a short position by adding a "long" position -- which creates upward pressure on the stock price. A long position mostly means buying a share, buying call options, or selling put options.
|
||||
|
||||
- The long position plus the short position, mathematically balanced, equals a neutral position.
|
||||
|
||||
- An MM that illegally counterfeits shares is looking to minimize the costs of their neutral position. They will adopt the most cost-effective position possible.
|
||||
|
||||
- The most likely cost-effective counter to a "net short" position is to sell puts.
|
||||
|
||||
- And while Citadel is [no stranger to selling to itself](https://www.reddit.com/r/GME/comments/lnctgx/citadel_is_an_evil_corp_look_at_its_track_records/) (which is called a "wash sale"), the practice of being both the buyer and the seller attracts a regulator's attention. Which, is something Citadel likely doesn't want happening for its illegal shorting scheme. So it needs to sell the puts to an outside party.
|
||||
|
||||
- *This means Citadel needs another organization to collude with.*
|
||||
|
||||
Part 3: Polo
|
||||
|
||||
1. If Citadel needs an accomplice, an easy target is a company that is already relying on Citadel in one way or another.
|
||||
|
||||
- Melvin lists Citadel as an investor[], and most likely depends on Citadel to be their Market Maker for securities orders.
|
||||
|
||||
- Melvin also embraces an aggressive shorting strategy[], which requires an abundance of shorts to execute.
|
||||
|
||||
- So the arrangement between Citadel and Melvin is thus:
|
||||
|
||||
- Citadel creates naked shares for Melvin to borrow or buy. Now Citadel is a "negative" position and they need to be a neutral position. Plus they are taking on risk by fabricating counterfeit shares...
|
||||
|
||||
- ...so Citadel writes ITM puts, and Melvin buys them - making Citadel net neutral. Pretend the premium on the puts is $5.
|
||||
|
||||
- Melvin immediately closes the position on the puts (a net $0 activity, and stems the risks to either party), and the transaction is complete.
|
||||
|
||||
- Melvin now has shorts to use, and Citadel nets $5 and remains neutral.
|
||||
|
||||
- The puts are merely a formality: they keep Citadel neutral and are a way to pay for the naked shorts.
|
||||
|
||||
- This is called a "married put" -- renting out a naked short tied to a put, for the price of the premium on the put.
|
||||
|
||||
- Afterwards, Melvin sells the naked shorts, profiting from the sale and also lowers the price of the stock closer to bankruptcy.
|
||||
|
||||
- And if things go badly for them, Citadel can compel Melvin to close out their shorts, or even intervene and close out the position themselves, while leveraging their powers as Market Maker.
|
||||
|
||||
- (*However, closing out seems unnecessary, doesn't it? Since they can always change a rising stock price with additional naked shorts...*)
|
||||
|
||||
- And if they want, Melvin and Citadel have additional means of concealing their activities:
|
||||
|
||||
- as part of the married put transaction, Melvin can turn and sell Citadel "out of the money" (OTM -- meaning, will expire worthless) calls as part of the transaction to make it look like standard activity.
|
||||
|
||||
- The combination of a put plus a call plus a share is called [a reverse conversion.](https://www.deepcapture.com/wp-content/uploads/2007.10.09-J-Welborn-Married-Puts-and-Reverse-Conversions.pdf)
|
||||
|
||||
- It's unclear if either Citadel or Melvin initiated the scheme. Citadel needs constant demand for the counterfeit shares, while Melvin needed abundant shorts - it's rumored that Melvin is a "[hitman hedge fund](https://www.reddit.com/r/WallStreetbetsELITE/comments/lw0cky/either_melvin_lied_about_closing_position_ms_in/)".
|
||||
|
||||
- But both parties needed someone who is unconcerned with the *actual* status of the shares being shorted. So it's clear both are aware of the illegal nature of the shares they are leveraging.
|
||||
|
||||
This sub has noticed records of strange banks of calls and puts, which represent probable evidence for the scheme described here.
|
||||
|
||||
* * * * *
|
||||
|
||||
Evidence [1](https://www.reddit.com/r/GME/comments/m7xipv/whale_watching_the_sweeping_seas_318/) [2](https://www.reddit.com/r/GME/comments/lsnlte/ok_so_random_theory/) [3](https://www.reddit.com/r/GME/comments/mhv22h/the_si_is_fake_i_found_44000000_million_shorts/)
|
||||
|
||||
* * * * *
|
||||
|
||||
Part 4: A Shiver (The Deacons)
|
||||
|
||||
1. However, in the highly competitive world of corporate finance, successful strategies like Melvin's and Citadel's are tracked, followed, copied, and mirrored.
|
||||
|
||||
- Naked shorting has been [around for awhile](https://www.reddit.com/r/GME/comments/mexlpn/accidentally_released_and_incredibly_embarrassing/), and the payouts are obvious.
|
||||
|
||||
- Other hedge funds or investment banks likely copied Melvin's actions on the same targeted companies, [aiming to profit from their actions without needing to research the strategy too much](https://www.reddit.com/r/GME/comments/mcwu5m/mystery_of_the_negative_beta_solved_hfs_are/)...
|
||||
|
||||
- ...which makes it likely that Citadel was also *fabricating shares for other hedge funds.*
|
||||
|
||||
- So it isn't only Citadel -- there are others involved in this crime.
|
||||
|
||||
- Additional players could also profit, and [assist](https://www.reddit.com/r/GME/comments/m9bfp0/naked_short_selling_the_truth_is_much_worse_than/) either legally or illegally.
|
||||
|
||||
- Susquehanna SIG -- a major Market Maker for options, had [substantial interest](https://www.reddit.com/r/Superstonk/comments/mlf82b/the_missing_citadels_frenemies_pfof_michael/) in this scheme. Their strategic puts could apply price pressure to the distressed companies and allow SIG to profit from the options placements -- and from price manipulation.
|
||||
|
||||
- Other investment banks and options sellers have also joined in. Their profits could be legal, approved market activity of buying puts or selling shorts. Or the profits could be illegal, resulting from naked shorting and manipulating the price downward.
|
||||
|
||||
- A partial list of large companies that have taken positions against GME include: [Melvin Capital, Citadel Advisors, SIG, UBS Group AG, Group One Trading, Citigroup, Wolverine Capital, and Maplelane Capital](https://www.reddit.com/r/wallstreetbets/comments/lw0g1g/the_industry_players_again_gme/).
|
||||
|
||||
- Coordinating their efforts can achieve a multiplier on their returns. By adopting the same positions as the others, each company assumed a smaller portion of exposure while enjoying the multiplied pressure from their group efforts.
|
||||
|
||||
- The risk of loss is still real, but it is diminished, and marginal compared to the collective assets and rewards.
|
||||
|
||||
Part 5: The Deep
|
||||
|
||||
1. As the conspirators coordinated their attacks, they needed a way to operate without gaining public attention.
|
||||
|
||||
- They were used to operating within the parameters of the enforcement agencies (SEC, FINRA)...
|
||||
|
||||
- ...and their activities would be recorded, regardless, on the public register.[]
|
||||
|
||||
- But off-exchange trading venues -- a.k.a. Dark Pools -- would be perfect for their needs.
|
||||
|
||||
- Dark Pools have delayed reporting. The transactions themselves are allowed more time to be recorded (10s -- an eternity in trading time)...
|
||||
|
||||
- ...and have the benefit of not being publicly reported by FINRA until [*WEEKS*](https://www.sec.gov/divisions/marketreg/form-ats-n-filings.htm) after the transactions had taken place.
|
||||
|
||||
- And Dark Pools intentionally keep transactions as anonymous as possible. Again, all transactions would be received by the register and would include the parties involved. But bids and asks that *didn't* end up transacting are never disclosed -- masking the real positions and intentions.
|
||||
|
||||
- But the most valuable part for the conspirators: unlike public exchanges, transactions that take place in Dark Pools do not affect the official national price -- the NBBO.
|
||||
|
||||
- Meaning, they could execute the trades that *negatively* affected the price in the public exchanges...
|
||||
|
||||
- ...and then execute the trades that *positively* affected the price in Dark Pools.
|
||||
|
||||
- So the price would only go down from their activities.
|
||||
|
||||
- And naturally, they could do so in just such a way that they could achieve their goals without attracting regulatory or public attention. (They were extremely familiar with toeing that line).
|
||||
|
||||
- While it is unclear if they *actively discussed* this scheme or coordinated each of their roles (institutional relationships can be tentative, or circumstantial - best described as "frenemies")...
|
||||
|
||||
- ...the transactions would act as tacit collaboration between the firms. They would be able to figure out who else was working with them, and what their position was.
|
||||
|
||||
- Collectively, they are very aware of their mutual positions, even without having explicitly discussed them. The volume, type, location, time, and other positional details would most likely give away what and who was transacting...
|
||||
|
||||
- ...while acting as a signal for others to respond to. Showing an opportunity to be siezed.
|
||||
|
||||
Again, the contributors of these subs have noticed high levels of corresponding transactions of $GME occuring in Dark Pools.
|
||||
|
||||
* * * * *
|
||||
|
||||
Evidence [1](https://www.reddit.com/r/GME/comments/mg5aui/hfs_traded_over_302_million_shares_of_gme_in_otc/) [2](https://www.reddit.com/r/Wallstreetbetsnew/comments/llbz1m/mindboggling_dark_pool_network_may_have_traded/) [3](https://www.reddit.com/r/wallstreetbets/comments/mnm8h0/gme_last_30_days_of_dark_pool_options_order_flow/)
|
||||
|
||||
* * * * *
|
||||
|
||||
Further reading on the overview: [u/boneywankenobi](https://www.reddit.com/u/boneywankenobi/) 's [deeper dive](https://www.reddit.com/r/GME/comments/mjzx9w/full_analysis_of_current_gme_si_proof_from_the/)
|
||||
|
||||
Further reading on married puts: [u/broccaaa](https://www.reddit.com/u/broccaaa/) 's fantastic research [here](https://www.reddit.com/r/Wallstreetbetsnew/comments/mgof7q/the_naked_shorting_scam_revealed_lending_of/) and [here](https://www.reddit.com/r/GME/comments/mh6lnz/the_naked_shorting_scam_update_selling_nude_like/)
|
||||
|
||||
Further reading on Dark Pools: [u/NoseBurner](https://www.reddit.com/u/NoseBurner/) 's [excellent recap](https://www.reddit.com/r/Superstonk/comments/mpvm3a/into_the_heart_of_darkness_darkpools_and_fud/), which refers to [u/umu68](https://www.reddit.com/u/umu68/) 's [prolific work](https://www.reddit.com/r/Superstonk/comments/movevb/dance_of_darkness_the_sec_and_dark_pools/)
|
||||
|
||||
* * * * *
|
||||
|
||||
TL;DR and Summary -- The speed, sophistication, and savvy of the firms illegally affecting the price of $GME and other stocks make it easy for them to collaborate. Each are playing their part -- naked shorting, writing options, providing legitimate cover, transacting in Dark Pools for effect -- according to their specialization. They are extremely financially incentivized to do so. Their familiarity with the regulations means they feel they are able to engage and even expand their scheme without legal consequences. And the tools they have at their disposal give them the means to execute their fraudulent enterprise at will. Some of the financial world's largest firms are complicit or are actively participating. They have assumed the public will not take notice, because the public had not taken notice. This line of reasoning is typically referred to as "Black Swan."
|
||||
|
||||
* * * * *
|
||||
|
||||
Calls to verify /e?/: [u/the_captain_slog](https://www.reddit.com/u/the_captain_slog/), [u/NoseBurner](https://www.reddit.com/u/NoseBurner/), [u/broccaaa](https://www.reddit.com/u/broccaaa/), [u/boneywankenobi](https://www.reddit.com/u/boneywankenobi/)
|
||||
|
||||
Credit roll (in order of appearance): [u/krisoijn](https://www.reddit.com/u/krisoijn/), [u/G_KG](https://www.reddit.com/u/G_KG/), [u/ElevationAV](https://www.reddit.com/u/ElevationAV/), [u/dejf2](https://www.reddit.com/u/dejf2/), [u/DigitalSoldier1776](https://www.reddit.com/u/DigitalSoldier1776/), [u/bobfern37](https://www.reddit.com/u/bobfern37/), [u/animasoul](https://www.reddit.com/u/animasoul/), [u/VaseaPost](https://www.reddit.com/u/VaseaPost/), [u/pinkcatsonacid](https://www.reddit.com/u/pinkcatsonacid/), [u/skifunkster](https://www.reddit.com/u/skifunkster/), [u/bimnett](https://www.reddit.com/u/bimnett/), [u/StonkyFarts](https://www.reddit.com/u/StonkyFarts/), [u/DIY-Dude-123](https://www.reddit.com/u/DIY-Dude-123/)
|
||||
|
||||
Special shout out to [u/GMEisLightandLove](https://www.reddit.com/u/GMEisLightandLove/), [u/beowulf77](https://www.reddit.com/u/beowulf77/)
|
||||
|
||||
Final note - some relevant news this week: <https://www.reddit.com/r/news/comments/mqql1f/ap_source_ponzi_schemer_bernie_madoff_has_died_in/>
|
||||
139
Crypto/2021-07-07-A-Crypto-Deep-Dive.md
Normal file
139
Crypto/2021-07-07-A-Crypto-Deep-Dive.md
Normal file
@ -0,0 +1,139 @@
|
||||
A crypto dive with the Jellyfish - 10 things about crypto that could be useful to know going into the 7/14 reveal.
|
||||
==================================================================================================================
|
||||
|
||||
| Author | Source |
|
||||
| :-------------: |:-------------:|
|
||||
| [u/Dismal-Jellyfish](https://www.reddit.com/user/Dismal-Jellyfish/) | [Reddit](https://www.reddit.com/r/Superstonk/comments/ofndb0/a_crypto_dive_with_the_jellyfish_10_things_about/) |
|
||||
|
||||
---
|
||||
|
||||
|
||||
[DD 👨🔬](https://www.reddit.com/r/Superstonk/search?q=flair_name%3A%22DD%20%F0%9F%91%A8%E2%80%8D%F0%9F%94%AC%22&restrict_sr=1)
|
||||
|
||||
[](https://preview.redd.it/7du1kjnfot971.jpg?width=320&format=pjpg&auto=webp&s=59591863e05125f8bd644d116f2b5d85aabac612)
|
||||
|
||||
Good afternoon r/Superstonk, Jellyfish here to try and discuss crypto (ducks!)
|
||||
|
||||
1\. NFTs
|
||||
|
||||
NFTs on E t h e r e u m are what I think everyone is most familiar with already. They are unique tokens that can be used by creators to tokenize a wide range of content (not just art).
|
||||
|
||||
[](https://preview.redd.it/lvao1vkmot971.png?width=891&format=png&auto=webp&s=5ff19d7073639abdfc1d05d3be0cd694c65a3d84)
|
||||
|
||||
According to a report by decentralized app marketplace DappRadar, the average number of NFT sales rose almost 300%, from 21,815 per day in January, to 82,373 in May (so far). This number rose even higher as crypto prices started to plummet on May 12, with sales surging to almost 94,000 NFT transactions a day.
|
||||
|
||||
2\. Smart Contracts
|
||||
|
||||
Smart Contracts automatically executes code once specific terms have been met. They first started as programmable money but are decentralized digital legos capable of lending, borrowing, swapping, and much more to come.
|
||||
|
||||
[](https://preview.redd.it/8cdhs7zqot971.jpg?width=1600&format=pjpg&auto=webp&s=e66c3ecbd4cddec46073ad8f9f1d495667d96801)
|
||||
|
||||
3\. DeFi
|
||||
|
||||
DeFi: has exploded but in GameStop's case, I think it might be leveraged for flexibility and its non-custodial nature. With DeFi, GameStop can become its own bank and cut out costly middlemen. This is also why [I think GameStop should participate in this FDIC sprint](https://www.reddit.com/r/Superstonk/comments/oevr9p/guys_the_fdic_might_not_realize_it_yet_but_they/)
|
||||
|
||||
[](https://preview.redd.it/t9wyuo4sot971.gif?format=mp4&s=233a990c2aea7d7c4e3f3f967b390d3bf6e674d5)
|
||||
|
||||
How it is today
|
||||
|
||||
[](https://preview.redd.it/dcbrp34uot971.png?width=729&format=png&auto=webp&s=5917e265b8dabec0ddd9e2f18eadf40f79015303)
|
||||
|
||||
How it could be
|
||||
|
||||
4\. Developers
|
||||
|
||||
E t h e r e u m is attracting the world's developers. Since Q3 2019, E t h e r e u m has gained more than 300 developers per month, with GameStop entering the fray with:
|
||||
|
||||
[Jordan Holberg @eviljordan](https://twitter.com/eviljordan), [Matt FinΞstonΞ | @finestonematt](https://twitter.com/finestonematt), [j@Cyberhorsey](https://twitter.com/Cyberhorsey)
|
||||
|
||||
5\. Interoperability
|
||||
|
||||
This is one area I feel many people are overlooking. E t h e r e u m will unlock potentially hundreds of billions of dollars in liquidity from POS blockchains through interchain accounts and interoperable staking.
|
||||
|
||||
[Maybe they work with NFT Ghost?](https://twitter.com/ghostnft?lang=en)
|
||||
|
||||
I see these guys as more of a competitor currently, but what if Dapper Labs want to take advantage of GameStop's brand loyalty customer base to market [Top Shot](https://nbatopshot.com/), [CryptoKitties](https://www.cryptokitties.co/?utm_source=dapperlabs), [Wizards](https://cheezewizards.com/?utm_source=dapperlabs), or [Dapper](https://www.meetdapper.com/?utm_source=dapperlabs) in the GameStop NFT Marketplace?
|
||||
|
||||
-[What if they partner with Age of Rust and let it on the GameStop NFT marketplace?](https://enjin.io/powered-by-enjin/age-of-rust)
|
||||
|
||||
0:00
|
||||
|
||||
2:13
|
||||
|
||||
Looks niffty!
|
||||
|
||||
6\. Metaverse
|
||||
|
||||
NFTs on E t h e r e u m will power a universe beyond our own like the Oasis in Ready Player One.
|
||||
|
||||
Virtual reality technology will power an augmented reality of virtual space and tokenized in-app purchases.
|
||||
|
||||
[](https://preview.redd.it/ahbjvus6pt971.jpg?width=300&format=pjpg&auto=webp&s=df069651e90d4016a1e16dbe2a3cd805b052b0eb)
|
||||
|
||||
7\. Decentralized autonomous organizations (DAOs)
|
||||
|
||||
DAOs are entities made up of any number of individuals who maintain the group's decisions in a distributed manner. Individuals can use tokens to vote and propose ideas they want for the protocol. I wouldn't be surprised if GameStop goes this route for governance. As a side note, I do see DAO's as the future of [r/Superstonk](https://www.reddit.com/r/Superstonk/) after MOASS for fairly and transparently kicking ass with tendies.
|
||||
|
||||
[](https://preview.redd.it/nir4ttr7pt971.png?width=446&format=png&auto=webp&s=e5f5cf8ed0f17e5573ea0a38d24e4d95279d8176)
|
||||
|
||||
8\. Layer Two (L2)
|
||||
|
||||
There are a lot of projects working on layer two scaling solutions in an effort to scale E t h e r e u m---big argument against E t h e r u m as it stands now as it cannot process enough transactions efficiently to scale.
|
||||
|
||||
L2 solutions (where GameStop will live) focus on highly complex topics ZK-rollups for example (great to have Matthew Finestone!) as they have the ability to bring E t h e r e u m to 2,000 TPS
|
||||
|
||||
[](https://preview.redd.it/fzc9kfvapt971.png?width=744&format=png&auto=webp&s=2ddf370809298a5b6d8e468d0cab18aea924e470)
|
||||
|
||||
GameStop's head of blockchain comes by way of Loopring
|
||||
|
||||
9\. EIP-1559
|
||||
|
||||
I think the company should allocate a portion of that to staking e t h e r e u m and offering the ability to stake to GameStop's user base.
|
||||
|
||||
In the future, I believe GME values decentralization of ownership of our digital assets, which is why we should buy and mint NFT's on GameStop's Blockchain.
|
||||
|
||||
For the less blockchain familiar GameStop users, I think GameStop should open up the protocol to allow E t h e r e u m 2 staking with GME. Empower the players to secure the metaverse?
|
||||
|
||||
For the balance sheet though, if you're staking on E t h e r e u m 2.0, E t h e r e u m 's parallel PoS network, your operations are earning you a roughly 8% annual percentage return (APR). This number is higher than the rate of inflation that we covered as well! Yes, E t h e r e u m fluctuates in price, but as we covered above, staking will also further secure and make the network stronger, which in turn does the same for the metaverse!
|
||||
|
||||
EIP-1559 is in flight. What this means is that the net "issuance" of new coins minted is going to be dramatically lowered. To put it in perspective, the issuance rate right now is 4.5% per year, the estimates for the issuance rate after EIP 1559 is implemented are .5 - 1%. Why does this matter?
|
||||
|
||||
So b I t c o in issuance halves every 4 years right? (this is what makes the stock-to-flow model tick) Well, an issuance drop from 4.5% is the equivalent of 3 halvenings happening at one time. (4.5 cut in half to 2.25 again to 1.125 and again to .56). E t h e r e u m is already at a multi-year low supply on exchanges, once this happens E t h e r e u m will become more instantly scarce. People have dubbed this the "Cliffening".
|
||||
|
||||
Right now, a lot of the crypto user interfaces 'for the less tech-savvy' are more akin to trying to navigate Windows 2.0 30+ years ago.
|
||||
|
||||
Currently, if you mess up a transaction (don't include enough gas for it to get picked up by a miner for example), the transaction will just sit. The process of updating said transaction can be *cumbersome* depending on how you are set up, to impossible if you are hoping to just have an iPhone like user experience.
|
||||
|
||||
EIP-1559 is going to go a long way to help on the usability front for users.
|
||||
|
||||
Clarifying further, with EIP-1559, anyone transacting would have to pay a total transaction cost, which would be known beforehand, completely eliminating the need for a bidding system, where your transaction could get stuck as I described above..
|
||||
|
||||
I hope that helps and I didn't screw anything up too badly!
|
||||
|
||||
But to tie this back to inflation, (because you know I can't help myself!), this also leaves the deflationary action of EIP-1559 intact :)
|
||||
|
||||
10\. S t a b l e c o i n s
|
||||
|
||||
E t h e r e u m is home to many stablecoins, which have grown bigly with differenrt use cases. For example:
|
||||
|
||||
$U S D T: $62B
|
||||
|
||||
$U S D C: $25B
|
||||
|
||||
$D A I: $5B
|
||||
|
||||
They are very popular for use in DeFi, but I think will be relevant to GameStop as VISA will soon accept transaction settlement in U S D C.
|
||||
|
||||
[](https://preview.redd.it/3v18fr8ppt971.gif?format=mp4&s=ae903e7f3b199528835d94cb78012ad615595494)
|
||||
|
||||
I hope this one makes it through Automod!
|
||||
|
||||
Additional posts you may enjoy:
|
||||
|
||||
<https://www.reddit.com/r/Superstonk/comments/o77tkp/is_anyone_else_totally_jacked_for_the_714/>
|
||||
|
||||
<https://www.reddit.com/r/Superstonk/comments/oc8xb0/its_a_problem_now_its_going_to_be_a_huge_problem/>
|
||||
|
||||
<https://www.reddit.com/r/Superstonk/comments/o9mk4q/does_anyone_else_think_comic_books_would_make_a/>
|
||||
|
||||
<https://www.reddit.com/r/Superstonk/comments/ob8mzm/jellyfish_putting_on_his_tinfoil_hat_for_a/>
|
||||
@ -0,0 +1,170 @@
|
||||
GME NFT Scamcoins, a Retroactive on yesterday events.
|
||||
=====================================================
|
||||
|
||||
| Author | Source |
|
||||
| :-------------: |:-------------:|
|
||||
| [u/Lucent_Sable](https://www.reddit.com/user/Lucent_Sable/) | [Reddit](https://www.reddit.com/r/Superstonk/comments/oa1bl7/gme_nft_scamcoins_a_retroactive_on_yesterday/) |
|
||||
|
||||
---
|
||||
|
||||
[DD 👨🔬](https://www.reddit.com/r/Superstonk/search?q=flair_name%3A%22DD%20%F0%9F%91%A8%E2%80%8D%F0%9F%94%AC%22&restrict_sr=1)
|
||||
|
||||
Hey Apes!
|
||||
|
||||
After yesterdays event where a user ended up purchasing a scam coin, I thought I would quickly write up a DD on how scamcoins commonly target uninformed GME investors.
|
||||
|
||||
This is my first attempt at writing anything that looks like a DD, and I will be focusing on a retroactive of the event and some things that you can look out for to prevent becoming a victim of these scamcoins.
|
||||
|
||||
If you think you are immune to being scammed, there is some interesting information on how easy it is to fool people on the internet [here](https://www.youtube.com/watch?v=dQw4w9WgXcQ).
|
||||
|
||||
Please let me know if there is anywhere where I can add more context or information, and especially if I got anything wrong, or was unclear. I will be periodically updating this post with information from the comments to make it a better resource.
|
||||
|
||||
1\. The anatomy of a scam
|
||||
|
||||
Any scam has three core components.
|
||||
|
||||
1. Get the targets trust
|
||||
|
||||
2. Convince the target to give you their money
|
||||
|
||||
3. Get away before the target realizes they have been scammed.
|
||||
|
||||
I will be covering these steps by giving examples from some common scams. I will then proceed to outline how I believe these steps happen in the new GME scamcoins.
|
||||
|
||||
- [Three-card Monte](https://en.wikipedia.org/wiki/Three-card_Monte)
|
||||
|
||||
- A confidence scam where shills conspire with a scammer to convince a target that they can win money in a street game.
|
||||
|
||||
- [Forex Scam](https://www.investopedia.com/articles/forex/09/spot-a-forex-scam.asp)
|
||||
|
||||
- A scam where a "professional trader" has some "special formula" that they can use to invest your money in foreign exchange markets.
|
||||
|
||||
- [Tech support scam](https://en.wikipedia.org/wiki/Technical_support_scam)
|
||||
|
||||
- A scammer calls a target and convinces them that there is a problem with their computer, which can only be fixed with their special antivirus software. The scammer will often request remote access to the targets computer, and may even request access to the targets bank account.
|
||||
|
||||
- [Romance Scam](https://www.fbi.gov/scams-and-safety/common-scams-and-crimes/romance-scams)
|
||||
|
||||
- The scammer pretends to be romantically interested in the target.
|
||||
|
||||
1.1 Trust
|
||||
|
||||
The first task of any scammer is to gain the targets trust. The target needs to believe that the scammer can provide something they want.
|
||||
|
||||
Three-card Monte
|
||||
|
||||
In this scam, the target wants to win a bet against the scammer in order to increase the amount of cash they have. The scammer gains trust by having shills publicly lose to them in the three-card Monte game, building the illusion that the target has a realistic chance of winning.
|
||||
|
||||
Forex Scam
|
||||
|
||||
In this scam, the target wants to earn passive income via investing. The scammer gains trust by showing the target some of the gains their trading platform or software is capable of. This is usually done through some form of internet communication, such as email or direct-messages on social media. Fabricated screenshots may be used to increase the perceived legitimacy of the scammer.
|
||||
|
||||
Tech support scam
|
||||
|
||||
The scammer pretends to be a representative of a well known company such as Microsoft or Amazon. They rely on the target trusting the reputations of large companies whose names they recognize, and the scammer may add a sense of urgency to the scam which can further impair the targets judgement.
|
||||
|
||||
Romance Scam
|
||||
|
||||
This is one of the more vile scams. The scammer builds the targets trust by pretending to be romantically interested in the target. The goal is to make the target believe that they have a genuine relationship with the scammer, and who doesn't trust the person they are in a relationship with!
|
||||
|
||||
1.2 Extracting the targets money
|
||||
|
||||
The second step, once the target trusts the scammer is to convince the target to give the scammer money.
|
||||
|
||||
Three-card Monte
|
||||
|
||||
This one is fairly obvious. The target puts forward money in a bet on the game, not knowing that the game is rigged and they cannot win. The scammer or shill may encourage the target to keep trying, as they "Just got unlucky". At this point the scam relies on the target believing that they can still make their money back, while they lose more and more.
|
||||
|
||||
Forex Scam
|
||||
|
||||
The scammer request access to the targets trading account, or requests that the target send them some money to get started. If the target is still hesitant, the scammer may request a smaller amount, and then provides some fake return on investment to further build the targets trust. The scammer will keep demanding higher deposits while promising that the system is working, until the target catches on.
|
||||
|
||||
Tech support scam
|
||||
|
||||
The scammer requests remote access to the targets computer, often under the guise of running diagnostics. Once they have "run their diagnostics", they will try to sell some overpriced antivirus software. To extract further money from the target, the scammer may call back at a later date, and either try to get the target to pay for a renewal, or offer a "refund" which they "over-pay", and then have the target send the difference back to them. Often the scammer edits HTML on the targets bank page, or has the transaction reversed before the target sends them the difference back.
|
||||
|
||||
Romance scam
|
||||
|
||||
The scammer contacts the target, who believes they are in a long distance relationship with the scammer. The scammer will tell the target that they have run into legal trouble, and need some money sent to them to cover bail or a lawyers fee. Other iterations of the scam may request money for fuel, gifts, medical bills, car repairs, or anything else you can imagine. The requests keep coming in as long as the target believes that the relationship is genuine. During this process the scammer will encourage the target to take out loans and max out credit cards, even borrow money from friends and family.
|
||||
|
||||
1.3 The Getaway
|
||||
|
||||
The final part of the scam is getting away without the target knowing they have been scammed, or not being able to do anything about it.
|
||||
|
||||
Three-card Monte
|
||||
|
||||
The target eventually realizes that they are not going to win, or runs out of cash. The scammer and shill may pack up the game in a hurry and run if the target is angry or indicates they may make trouble, otherwise they will just convince the target that they got unlucky. This scam is often targeted toward tourists, as this prevents targets coming to personally recognize the scammers.
|
||||
|
||||
Forex and tech support
|
||||
|
||||
The scammer will stop responding to the target, and will launder the money any number of ways. The target never actually knew the real identity of the scammer, and was most likely paying money into a stolen or foreign (or both) bank account.
|
||||
|
||||
Romance Scam
|
||||
|
||||
If the scammer is called out on their scam, they will often start gaslighting their target. Often, due to the nature of the relationship in the scam, the target will not believe that they are being scammed, even when provided with otherwise irrefutable evidence. If they do eventually catch on, the scammer often has the same anonymity as in the Forex and Tech support scams. The target doesn't know the scammers real identity and has little to no recourse to get their money back.
|
||||
|
||||
2\. The GME NFT Scam
|
||||
|
||||
At this point you are probably thinking: That's interesting Lucent_Sable, but what does it have to do with GME?
|
||||
|
||||
2.1 History of GME NFT
|
||||
|
||||
Apes recently discovered that Gamestop is working on something to do with Etherium NFT tokens. This was found through an official Gamestop website: [nft.gamestop.com](https://nft.gamestop.com/). This is our root of trust, we know that this is officially Gamestop, as it is on the Gamestop.com domain.
|
||||
|
||||
On this website, there is an Etherium address: 0x13374200c29C757FDCc72F15Da98fb94f286d71e.
|
||||
|
||||
Apes looked into this address on [etherscan](https://etherscan.io/address/0x13374200c29C757FDCc72F15Da98fb94f286d71e), and found the contract for a GME coin. We know that we can trust this contract at this specific address, because it is on the official Gamestop web-site.
|
||||
|
||||
A screenshot of the etherscan page is available [here](https://i.imgur.com/u2Pvega.png).
|
||||
|
||||
In the screenshot, the areas outlined in Green are things that we can trust as directly describing the contract and the creator of the contract. Areas outlined in Red are things that anyone can influence by interacting with the contract, we cannot trust the information in these as they are influenced by public activity. The area in black is an information block, related to what is selected.
|
||||
|
||||
From the information on this page that we can trust, we can determine the following
|
||||
|
||||
1. The contract was created by another contract: 0xce0042B868300000d44A59004Da54A005ffdcf9f
|
||||
|
||||
2. The contract describes a token called Gamestop (GME)
|
||||
|
||||
3. The code of the contract, which has been analysed by apes for important information
|
||||
|
||||
These are the facts about the contract that we know we can trust. [u/teacoat___](https://www.reddit.com/u/teacoat___/) consolidated this information in their [DD here](https://www.reddit.com/r/Superstonk/comments/nl0lk1/gme_token_info/).
|
||||
|
||||
Now that we have established what we know, on to the scam...
|
||||
|
||||
2.2 The scam
|
||||
|
||||
Yesterday, [u/samyall](https://www.reddit.com/u/samyall/) noticed a transaction involving the GME contract, in [this thread](https://www.reddit.com/r/Superstonk/comments/o9967o/gme_just_transferred_42069_gmetoken_to_itself_on/?utm_medium=android_app&utm_source=share).
|
||||
|
||||
Let me be very clear: I am not accusing samyall of anything, and believe that they were deceived by the scammers.
|
||||
|
||||
Image for following discussion [here](https://i.imgur.com/cZHRbfI.png).
|
||||
|
||||
2.2.1 Building trust
|
||||
|
||||
The information provided in samyalls post shows information on the "Erc20 Token Txns" tab. If a user is unfamiliar with what this is, they may incorrectly assume that the information in this tab is from Gamestop, as it is on the page for the official gamestop token. We know that this is not true and that anyone can send tokens to the contract address without Gamestop approving the transaction.
|
||||
|
||||
Second, we can look at the address that sent this scamcoin to the official Gamestop contract. The address of this scammer is\
|
||||
0x133742073133c9aecdEC3a87e475C2945f23D6C0\
|
||||
which at first glance is very similar to the contract address\
|
||||
0x13374200c29C757FDCc72F15Da98fb94f286d71e\
|
||||
I believe that this address was specifically crafted to further build trust. The most recognisable first digits of the contract address and the scammers address (0x1337420) match, and many users would not look much further than that.
|
||||
|
||||
Third, we look at the name of the token that the scammer sent to Gamestop. This scamcoin is called "GameStop (GME)", which is very similar to the official token name "Gamestop (GME)".
|
||||
|
||||
Finally, we can look at the etherscan profile of the scammer address (image [here](https://i.imgur.com/yiRkV5U.png)) This shows that the scammer created 69,420,000 tokens. This is both similar to the number of outstanding shares ~70 Million, and a funny internet number (69 & 420 are in it). This further builds legitimacy as it is similar to what we would expect to see, and plays to our biases.
|
||||
|
||||
2.2.2 Extracting money
|
||||
|
||||
The scammer had convinced at least one member of our community ([u/shroommyBoom](https://www.reddit.com/u/shroommyBoom/)) was convinced by this scam coin, and lost about $30, in this [post](https://old.reddit.com/r/Superstonk/comments/o99ms3/stay_calm_but_i_think_the_nft_is_now_available_to/). As you can see, the extraction of money from this scam is very easy, as all you have to do is convince the target that they want to purchase your scamcoin.
|
||||
|
||||
2.2.3 The Getaway
|
||||
|
||||
In this instance, the getaway is simple, as crypto provides both anonymity and irreversibility, so the scammer can simply disappear without anyone ever having known their identity.
|
||||
|
||||
3\. Key Takeaways (TLDR)
|
||||
|
||||
Be careful when interprating information about the Gamestop NFT, make sure that you can verify that you trust the source of the information. Just because the information is on the official contracts Etherscan page, doesn't mean the information is endorced by Gamestop.
|
||||
|
||||
At least one member of the community has been scammed by this scammer, and lost a small amount of money.
|
||||
|
||||
Scammers will try many tricks to get you to trust them, and separate you from your money. Don't fall for it, and if in doubt use the four-hour rule. Post on superstonk and give about 4 hours for other members of the community to analyze and sniff out anything suspicious. Remeber, nothing is urgent around here.
|
||||
@ -0,0 +1,144 @@
|
||||
A Deep Dive into nft.gamestop.com
|
||||
=================================
|
||||
|
||||
| Author | Source |
|
||||
| :-------------: |:-------------:|
|
||||
| [u/schismsaints](https://www.reddit.com/user/schismsaints/) | [Reddit](https://www.reddit.com/r/Superstonk/comments/of20ou/a_deep_dive_into_nftgamestopcom/) |
|
||||
|
||||
---
|
||||
|
||||
[DD 👨🔬](https://www.reddit.com/r/Superstonk/search?q=flair_name%3A%22DD%20%F0%9F%91%A8%E2%80%8D%F0%9F%94%AC%22&restrict_sr=1)
|
||||
|
||||
To start, PLEASE take a look at the graphic as it shows the relationships between the GME tokens a lot more clearly than I've seen anywhere else so far - [GitHub - schismsaints/GME_NFT](https://github.com/schismsaints/GME_NFT)
|
||||
|
||||
Like many, I was intrigued when I heard about GameStop dabbling in NFT - first, through the [job postings](https://finance.yahoo.com/news/gamestop-hiring-blockchain-analyst-specializing-075700175.html), then with [nft.gamestop.com](https://nft.gamestop.com/). I did a [brief dive into some of the smart contract details](https://www.reddit.com/r/Superstonk/comments/nkxrhe/umm_guys_i_think_i_just_found_something/gzgpytb/?context=3) back when it initially came out but recently have gone much further down the rabbit hole.
|
||||
|
||||
I'll summarize some of the juicier bits and provide some speculation as to what it could mean as well as some resources to familiarize yourself with some of the details of blockchain, smart contracts, and tokens, but I have put together a [larger graphic](https://github.com/schismsaints/GME_NFT) in PNG/PDF/SVG formats visualizing some of the connections a little better (fair warning, I'm an engineer not an artist). I recommend loading it in a full web browser on as large of a monitor as possible. You'll understand why when you see it.
|
||||
|
||||
First, a few key terms/concepts.
|
||||
|
||||
Blockchain: In very simplistic terms, think of the blockchain as a ledger/record keeping system where each 'block' is a record and linked to the previous and next blocks in a chain. The process of adding a new 'block' involves computing and verifying prior information in the chain to ensure that nothing has been tampered with and that the full history of the chain is intact.
|
||||
|
||||
[Blockchain Definition: What You Need to Know (investopedia.com)](https://www.investopedia.com/terms/b/blockchain.asp)
|
||||
|
||||
Fungible: "being something (such as money or a commodity) of such a nature that one part or quantity may be replaced by another equal part or quantity in paying a debt or settling an account " (src: dictionary.com)
|
||||
|
||||
Token: This is probably the part most people understand, though there are some nuances. There are two types of tokens and a number of differing implementation standards.
|
||||
|
||||
- Fungible Token - ERC-20: A token that is one of a pool of identical tokens. They can be split, transferred, or exchanged and are commonly used as currencies. Most established mainstream or alt- coins fall into this category.
|
||||
|
||||
- [Cryptocurrency Definition (investopedia.com)](https://www.investopedia.com/terms/c/cryptocurrency.asp)
|
||||
|
||||
- Non-Fungible Token (NFT) - ERC-721/ERC-1155: A non-fungible token is a unique entity on the blockchain. There are no others exactly like it, and it has its own record of ownership, attributes/metadata, and cannot be substituted for another token identically. [CryptoKitties](https://www.cryptokitties.co/) is one of the most popular examples as they basically pioneered the ERC-721 standard. NFT artwork is another recently popularized example of this.
|
||||
|
||||
- [Non-Fungible Token Definition: Understanding NFTs (investopedia.com)](https://www.investopedia.com/non-fungible-tokens-nft-5115211)
|
||||
|
||||
[](https://preview.redd.it/hj74bjb47n971.png?width=300&format=png&auto=webp&s=b8fcbbce01a45c57fc93680483f9519a470ef057)
|
||||
|
||||
Non-Fungible Kitties!
|
||||
|
||||
Smart Contract: A smart contract is a way to automate 'stuff'. That 'stuff' can be any number of tasks but some of the most common ones include creating (minting) or destroying (burning) tokens from an available pool. This can be fungible or non-fungible tokens (or, in the case of ERC-1155, both/either).
|
||||
|
||||
[Smart Contracts Definition (investopedia.com)](https://www.investopedia.com/terms/s/smart-contracts.asp)
|
||||
|
||||
The GME NFT story started in earnest with GameOn Anon, the smart contract address posted at [nft.gamestop.com](https://nft.gamestop.com/)
|
||||
|
||||
[](https://preview.redd.it/x352qjj57n971.png?width=268&format=png&auto=webp&s=2c0d1ab1a3a208cd3b86a9dc799603a52463edd0)
|
||||
|
||||
Power to the Players
|
||||
|
||||
[0x13374200c29C757FDCc72F15Da98fb94f286d71e](https://etherscan.io/address/0x13374200c29C757FDCc72F15Da98fb94f286d71e)
|
||||
|
||||
There are a lot of interesting threads from the smart contract, the most well known of which is the "launchDate" variable which equals 04:20 PDT 7/14/21 (come on, that can't *not* be intentional).
|
||||
|
||||
[](https://preview.redd.it/bja10vi67n971.png?width=633&format=png&auto=webp&s=a2cb5526b08222b15f4cfb9b8284c5faac57585d)
|
||||
|
||||
The [owner](https://etherscan.io/address/0x10b16eede03cf73cbf44e4bfffa3e6bff36f1fad) of the smart contract is also interesting.
|
||||
|
||||
It owns the only GME ERC-721 token, 420.69 of the GME ERC-20 token, an E t h e r e u m Name Service record ([gamestopnft](https://etherscan.io/token/0x57f1887a8bf19b14fc0df6fd9b2acc9af147ea85?a=0x10b16eede03cf73cbf44e4bfffa3e6bff36f1fad#inventory)), and the 1337 [email signature](https://etherscan.io/token/0xc9ff785a33f2000652d0336e476a06ccd909317a?a=0x10b16eede03cf73cbf44e4bfffa3e6bff36f1fad#inventory) prefix used for several blockchain constructs.
|
||||
|
||||
It also received 0.00001337 E t h e r on 5/25/21 from andrwyng (wut doing Andrew Yang??)
|
||||
|
||||
Edit: Not actually Yang - <https://mobile.twitter.com/andrwyng?lang=en> - thanks [/u/No-Information-6100](https://www.reddit.com/u/No-Information-6100/)
|
||||
|
||||
[](https://preview.redd.it/hprlbkr77n971.png?width=759&format=png&auto=webp&s=efef7ea335484ab1cef7f0e86fce04a2602f48f3)
|
||||
|
||||
False alarm, but had me very intrigued when I saw it initially.
|
||||
|
||||
There are three GameStop specific tokens they appear to be working with, along with a number (>20) altcoins and other tokens.
|
||||
|
||||
- [GME Coin (ERC-20)](https://etherscan.io/token/0xd4596454a0e145842d1319d6921399e8e1622ad7) - Qty 12,000,000
|
||||
|
||||
- Possible online store/digital currency? Would be interesting if it functioned similar to a [stablecoin](https://www.investopedia.com/terms/s/stablecoin.asp) pinned to the dollar
|
||||
|
||||
- [GameStop (ERC-20)](https://etherscan.io/token/0x5b7d043ecb3a694069cc01e763159ea1bde0541d) - Qty 69,420,000
|
||||
|
||||
- They moved a large amount of this (>50%) to [Uniswap](https://en.wikipedia.org/wiki/Uniswap) which in layman's terms can be considered as kind of an escrow/holding/forex account but in the crypto realm. Quite a few have been distributed from here to over 60 different destination addresses.
|
||||
|
||||
- Yahoo! Finance lists the 'Implied Shares Outstanding' for GME as 69.38M, which is preeeeeetty close to the 69.42M tokens minted here. Could this be used as a shareholder dividend, potentially exchangeable between GameStop and GME Coin/USD?
|
||||
|
||||
[](https://preview.redd.it/qm9w71ba7n971.png?width=336&format=png&auto=webp&s=8d3b8613f980d06adf1f2a7eca4bcfe792081704)
|
||||
|
||||
[](https://preview.redd.it/0jexo0qa7n971.png?width=1334&format=png&auto=webp&s=6f5ab609573617f84a25e54a5df67ff3a7a295cd)
|
||||
|
||||
[](https://preview.redd.it/yppy9h3b7n971.png?width=1347&format=png&auto=webp&s=fdeece7225eafafb264cfc3a3beb0e0e458a0573)
|
||||
|
||||
- [Gamestop (ERC-721)](https://etherscan.io/address/0x13374200c29C757FDCc72F15Da98fb94f286d71e) - Qty 1
|
||||
|
||||
- There is only one of these in existence at this point with no clear use for it yet, but there are some interesting possibilities I've considered such as blockchain-based share tracking (i.e. each NFT would have a 'share # X' value on it) or as a shareholder ID token ('shareholder # X'). This one has the least clear forward looking use case at this point for me.
|
||||
|
||||
Possible Business Uses
|
||||
|
||||
- In-store currency - GME Coin can be used as an in-store currency/reward system
|
||||
|
||||
- Crypto swap/exchange - Partner with an established cryptocurrency company to facilitate listing and conversion/exchange between stablecoins such as USDC or miscellaneous established coins or altcoins, and GME specific tokens. Use a GME app to manage a crypto wallet and exchange between various tokens/coins/currencies.
|
||||
|
||||
- NFT Collectibles - i.e. CryptoKitties, Gods Unchained, etc. Facilitate in-person trading (either in-store or via app to app trading) of digital items and collectibles between platforms.
|
||||
|
||||
- Digital game licensing - revolutionize DRM by hosting a record of your game license on the blockchain
|
||||
|
||||
- In-game item transfer/entitlement - Imagine if there was a way to trade/sell your CounterStrike skins in-person for cash, or exchange a cool knife skin for a new CryptoKitty
|
||||
|
||||
Possible Shareholder Uses
|
||||
|
||||
- Shareholder record keeping - have a token proving your status as a shareholder
|
||||
|
||||
- Share/securities record keeping - similar, but for shares. Kind of a stretch but could be a proof of concept for blockchain based trading
|
||||
|
||||
- Crypto Dividend - Provide GameStop (ERC-20) tokens, even fractional ones, as a shareholder dividend. Allow conversion to USD or GMECoin/USD to cash out. Provide a way to purchase or 'auction' GameStop tokens and you now have a shareholder perk with monetary value that could appreciate over time.
|
||||
|
||||
Here's the PDF of the chart/diagram I put together, the github link also has PNG and SVG versions of the image.
|
||||
|
||||
[GME_NFT/GME_NFT.pdf at main - schismsaints/GME_NFT - GitHub](https://github.com/schismsaints/GME_NFT/blob/main/GME_NFT.pdf)
|
||||
|
||||
TL:DR; GME doing crypto stuff. Lots of crypto stuff happening especially in the last week. Crypto stuff has lots of options, most of which will print money.
|
||||
|
||||
[](https://preview.redd.it/m98p6jtc7n971.png?width=492&format=png&auto=webp&s=28d229a20045e33ea3b43ab8b8557830a0970a25)
|
||||
|
||||
I like money
|
||||
|
||||
Edit: to answer a good point brought up by [/u/haydonny1](https://www.reddit.com/u/haydonny1/) in the previous thread before I screwed it up with this edit :( - the alt coins could be sent by any random source and aren't concrete proof of anything. I still maintain that the three GME tokens are legitimate and all have ties back to the original Smart Contract either one or two levels removed. I haven't investigated the altcoin sources enough to be able to say whether or not they're being worked on by GME at this point.
|
||||
|
||||
0x13374200c29C757FDCc72F15Da98fb94f286d71e
|
||||
|
||||
- Is the address posted on [nft.gamestop.com](https://nft.gamestop.com/)
|
||||
|
||||
- Owns 69,420.69 GameStop ERC-20 tokens
|
||||
|
||||
- Owns 2,000,000 GME Coin ERC-20 tokens
|
||||
|
||||
0x10B16eEDe03cF73CbF44e4BFFFa3e6BFf36F1Fad
|
||||
|
||||
- Is the Smart Contract address listed in the source code of the [nft.gamestop.com](https://nft.gamestop.com/) smart contract.
|
||||
|
||||
- Holds 1 Gamestop ERC-721 token
|
||||
|
||||
- Holds 420.69 GameStop ERC-20 tokens
|
||||
|
||||
- Holds gamestopnft.e t h and 1337 ERC-721 tokens
|
||||
|
||||
Double Edit: I'm seeing a lot of debate about the ERC-20 GameStop token and whether it's related to a scam site (game-coin or something, I think it's been pulled down and I can't find an archive now). At this point after digging multiple levels deep, I'm seeing a lot of conflicting information in the transaction logs and Uniswap destinations and I can't definitively say whether it's a scam or legit. I'm working on updating the graphic and will include a disclaimer, though I do still want to keep it in the picture until we can definitively rule it in or out.
|
||||
|
||||
Big thanks to [/u/HandyBananaMan](https://www.reddit.com/u/HandyBananaMan/), [/u/Peteszahh](https://www.reddit.com/u/Peteszahh/), [/u/EngineeringDude2017](https://www.reddit.com/u/EngineeringDude2017/) and others for their discussion and links to other resources. I have more work to do.
|
||||
|
||||
I'd hope it should go without saying, but don't buy a GME token on something that's not a GME app :)
|
||||
@ -0,0 +1,99 @@
|
||||
A Deep Dive into nft.gamestop.com - Part 2: Electric Boogaloo
|
||||
=============================================================
|
||||
|
||||
| Author | Source |
|
||||
| :----: | :----: |
|
||||
| [u/schismsaints](https://www.reddit.com/user/schismsaints/) | [Reddit](https://www.reddit.com/r/Superstonk/comments/oh0zfe/a_deep_dive_into_nftgamestopcom_part_2_electric/) |
|
||||
|
||||
---
|
||||
|
||||
|
||||
[DD 👨🔬](https://www.reddit.com/r/Superstonk/search?q=flair_name%3A%22DD%20%F0%9F%91%A8%E2%80%8D%F0%9F%94%AC%22&restrict_sr=1)
|
||||
|
||||
[](https://preview.redd.it/lzsb9ky2h7a71.png?width=225&format=png&auto=webp&s=8d709e3952f111fa21f696a57a2c7a0104475412)
|
||||
|
||||
Hi, I'm Troy McClu...err, /u/schismsaints
|
||||
|
||||
You might remember me from my reddit hits such as "Why does AutoMod hate everything I do?", or [my most recent post from a couple of days ago](https://www.reddit.com/r/Superstonk/comments/of20ou/a_deep_dive_into_nftgamestopcom/).
|
||||
|
||||
I wanted to update my previous DD with some recent findings, clearing up a few points as well as expanding on the research I've done thus far. As before, you can find the current DD image in multiple formats here at my GitHub repo - <https://github.com/schismsaints/GME_NFT>
|
||||
|
||||
To start, if you aren't familiar with basic blockchain concepts, [my previous post](https://www.reddit.com/r/Superstonk/comments/of20ou/a_deep_dive_into_nftgamestopcom/) and [this one](https://www.reddit.com/r/Superstonk/comments/ofndb0/a_crypto_dive_with_the_jellyfish_10_things_about) from [/u/Dismal-Jellyfish](https://www.reddit.com/u/Dismal-Jellyfish/) (seriously, it's well worth a read) will help get you up to speed on the different token types, smart contracts, and other general blockchain concepts.
|
||||
|
||||
An Update on GME Tokens
|
||||
|
||||
- [ERC-20 GameStop.finance scam token](https://etherscan.io/token/0x9eb6be354d88fd88795a04de899a57a77c545590) - Obvious scam is obvious, but finding this token gave me a link to be able to more conclusively debunk the 69,420,000 ERC-20 token
|
||||
|
||||
[](https://preview.redd.it/tcf7cmqnr7a71.png?width=256&format=png&auto=webp&s=c4e2a7928d64cbbfc523ab59b7ade084dba3eef4)
|
||||
|
||||
[](https://preview.redd.it/ami03a1ur7a71.png?width=249&format=png&auto=webp&s=72c594892dfb607b865f03f9ef8f28755837fe9d)
|
||||
|
||||
"The missing link"
|
||||
|
||||
- [ERC-20 GME GameStop Token](https://etherscan.io/token/0x5b7d043ecb3a694069cc01e763159ea1bde0541d) - Thanks to several of the commenters on my last post(s), I went through a deeper dive into the ERC-20 GME ('fake 1337420' address) token and agree that it is likely a scam.
|
||||
|
||||
- The two most solid pieces of evidence identifying the scam are:
|
||||
|
||||
- [0xfoobar directly disputing its validity](https://twitter.com/0xfoobar/status/1409740353738096641?s=21)
|
||||
|
||||
- [More than one address holding the confirmed scam token as well as this one](https://etherscan.io/tokenholdings?a=0xfb5484a510c48c307fd0253ee4d0a0866950f9a3)
|
||||
|
||||
- [There is one address](https://etherscan.io/address/0x7f8c1877ed0da352f78be4fe4cda58bb804a30df) which has ties to some potentially relevant blockchain companies (Cudo primarily) that had me doubting early on whether it was a scam, but on further research I've found a lot of links to Nigeria, Dubai, etc which, while not red flags in and of themselves, certainly don't line up with GameStop corporate hiring their own domestic blockchain team.
|
||||
|
||||
[](https://preview.redd.it/1wimkjrp48a71.png?width=738&format=png&auto=webp&s=313c9516cfef292f5a4570e971a292ddce3810f7)
|
||||
|
||||
Largest single GME ERC-20 Token holder address
|
||||
|
||||
- [ERC-20 GME Coin Token](https://etherscan.io/token/0xd4596454a0e145842d1319d6921399e8e1622ad7) - I have identified [an external account](https://etherscan.io/address/0x503828976d22510aad0201ac7ec88293211d23da) involved in funding the GME Coin address, but the trail went cold after that. I can't confirm or deny that it is legitimate at this point; in either event, whoever created it went through more effort to hide their tracks than the other tokens. It does not appear to have been sold/swapped anywhere as of yet.
|
||||
|
||||
- [ERC-721 GME GameStop Token ("The One and Only")](https://etherscan.io/token/0x13374200c29C757FDCc72F15Da98fb94f286d71e) - I suspect this will be the only one of its kind minted, either as a teaser or POC token for further NFT work.
|
||||
|
||||
- One interesting possibility came to mind that - while not a crypto dividend per-se - could still have some interesting applications to securities exchanges or implications for the MOASS. Caution: Speculation/theorycrafting inbound
|
||||
|
||||
- Consider the scenario involved with shareholder voting, where each shareholder receives a control number on each brokerage where they hold shares. Each control number is associated with the number of shares held at a point in time snapshot.
|
||||
|
||||
- With ERC-721 or ERC-1155, a unique NFT could be minted for each shareholder/control number. The number of shares associated with each NFT could either be held in an external DB or as metadata (a field on the token itself).
|
||||
|
||||
- This would create a public record of the number of shares held by individual shareholders at a point in time and could be updated on an annual basis (or more frequently if desired) in line with shareholder voting standards.
|
||||
|
||||
- This also avoids the 'crypto dividend' hangups associated with Overstock as there isn't any money involved nor is there any way this method could prevent legitimate short selling - it's merely a public ledger of shares in circulation.
|
||||
|
||||
- Alternatively, if they do a crypto coin dividend instead of a crypto stock dividend like Overstock, presumably they wouldn't place the same restrictions on selling which was the main point of contention in the Overstock case as I understand it. See below for some reading on Overstock.
|
||||
|
||||
- <https://realmoney.thestreet.com/investing/stocks/overstock-is-paying-a-digital-dividend-and-it-gets-really-interesting-now-15037958>
|
||||
|
||||
- <https://www.irmagazine.com/technology-social-media/how-overstock-used-blockchain-distribute-its-digital-dividend>
|
||||
|
||||
[/u/No-Fox-1400](https://www.reddit.com/u/No-Fox-1400/) has a lot of the same thoughts I do in his posts here:
|
||||
|
||||
- <https://www.reddit.com/r/Superstonk/comments/ofiev4/the_man_with_the_plan/>
|
||||
|
||||
- The timeline here including Overstock was an excellent read, but the part I really want to call out is this
|
||||
|
||||
[](https://preview.redd.it/olsculkf38a71.png?width=678&format=png&auto=webp&s=dbdaefd50c398f333896a14a204bafaa79334fd2)
|
||||
|
||||
This is in line with my thoughts on timing - NFT platform launch on 7/14, announcement of dividend/crypto play on 7/14, and record date for a crypto based dividend on 7/24
|
||||
|
||||
- And here: <https://www.reddit.com/r/Superstonk/comments/ocvqlp/the_rules_dont_matter/>
|
||||
|
||||
[](https://preview.redd.it/89f8rnnw38a71.png?width=692&format=png&auto=webp&s=edc369dbfdb253baf183cdf837c9f725610a5a58)
|
||||
|
||||
Recent Activity
|
||||
|
||||
[/u/clawesome](https://www.reddit.com/u/clawesome/) and [/u/nuclear-falcon](https://www.reddit.com/u/nuclear-falcon/) noticed some recent activity on the original smart contract here
|
||||
|
||||
<https://www.reddit.com/r/Superstonk/comments/ogjbcy/one_of_the_addresses_associated_with_the_gamestop/>
|
||||
|
||||
I've drawn out these relations on the long format diagram, shown below
|
||||
|
||||
[](https://preview.redd.it/507nrqd258a71.png?width=530&format=png&auto=webp&s=26992c61f9346de0a90cc46bea65c17011018810)
|
||||
|
||||
Adding approving parties/other devs to the owner/approval list
|
||||
|
||||
Huge credit to [/u/HandyBananaMan](https://www.reddit.com/u/HandyBananaMan/) for being almost as obsessed with the transaction logs as me and pointing me toward several bread crumbs along the way.
|
||||
|
||||
TL:DR; Buy, Hold, Buckle Up. GME Blockchain team hard at work to bring us something mind blowing. I expect that *even if* a crypto dividend does not materialize, the [nft.gamestop.com](https://nft.gamestop.com/) project will be revolutionary and will function as a large catalyst for price movement regardless of a dividend play.
|
||||
|
||||
[](https://preview.redd.it/i09xoc4e78a71.png?width=4808&format=png&auto=webp&s=03f646219e746517c83364692af14e96180906d6)
|
||||
|
||||
This is the PNG format of the diagram here for convenience, but the current version is always on my GitHub repo.
|
||||
59
DD/2021-04-27-Method-for-Hiding-FTDs-using-Useless-Puts.md
Normal file
59
DD/2021-04-27-Method-for-Hiding-FTDs-using-Useless-Puts.md
Normal file
@ -0,0 +1,59 @@
|
||||
A Method for Hiding FTD's That Uses the 1.09mil Useless Puts Discovered by /u/defj
|
||||
==================================================================================
|
||||
|
||||
| Author | Source |
|
||||
| :-------------: |:-------------:|
|
||||
| [u/eastrod](https://www.reddit.com/user/eastrod/) | [Reddit](https://www.reddit.com/r/Superstonk/comments/mzgtvx/a_method_for_hiding_ftds_that_uses_the_109mil/) |
|
||||
|
||||
---
|
||||
|
||||
|
||||
[DD 👨🔬](https://www.reddit.com/r/Superstonk/search?q=flair_name%3A%22DD%20%F0%9F%91%A8%E2%80%8D%F0%9F%94%AC%22&restrict_sr=1)
|
||||
|
||||
Apes and apettes, I'm jacked to the tits!!!
|
||||
|
||||
TL;DR the economic terrorists have given us clear evidence in my opinion that they are resetting FTD's for at least 109 million phantom shares per cycle using cheap OTM puts
|
||||
|
||||
I think I may have finally stumbled upon something that can help us in our efforts to discover just how deep a hole the short hedge funds are in.
|
||||
|
||||
Huge credit to [/u/dejf2](https://www.reddit.com/u/dejf2/) (sorry I spelled your name wrong in the title) who posted this earlier today:
|
||||
|
||||
<https://reddit.com/r/Superstonk/comments/mz7c7h/put_anomalies_pt1_were_127_million_synthetic/>
|
||||
|
||||
He found 1.09 million useless cheap puts being traded and then closed before the end of the same trading day and it turned on a light bulb in my primate brain, taking me back to an article I read recently while digging into some other companies that were victims of naked short selling.
|
||||
|
||||
<https://i.imgur.com/MSu2MOl.jpg>
|
||||
|
||||
This is a screenshot highlighting a section taken from this letter to the SEC - it is a good read but the relevant portion is in the imgur link.
|
||||
|
||||
Here is a link to the whole document if any other apes want to look into it:
|
||||
|
||||
<https://www.sec.gov/comments/s7-30-08/s73008-17.pdf>
|
||||
|
||||
The method for creating phantom (naked) shares goes as follows:
|
||||
|
||||
- Hedge fund (Melvin) buys a put (or 1.09 million puts)
|
||||
|
||||
- Market Maker (Shitadel) sells that put and is legally entitled to create and sell 100 phantom shares (or 109 million phantom shares) to hedge the put(s) they just wrote to remain neutral on the trade
|
||||
|
||||
- Hedge fund then sells that put back to the Market Maker except the Market Maker doesn't buy back the phantom shares leaving them net short on the stock and having pocketed the cash for the phantom shares that they did not need a borrow for
|
||||
|
||||
Now this is where I snorted a couple of the fat crayons and had a brand new wrinkle form inside my otherwise smooth brain:
|
||||
|
||||
The market maker could be using the method above (selling puts and then buying them back for the same price) as an excuse to create new phantom shares and then selling them to the short hedge funds - the ones trying to hide fuck tons of FTD's. This makes the short hedge funds look like they bought shares to clear their FTD's and then the hedge funds sell the share right back to the MM for the same price to create a neutral (net $0) trade while resetting the FTD countdown, essentially kicking the can down the road a little further and hiding 109 million shares of their short position from being reported as FTD's.
|
||||
|
||||
Where would a Market Maker and a short hedge fund likely conduct this trade? In a fucking dark pool where they aren't competing with retail for the shares of course; a potential explaination for the insane amount of dark pool trading occuring lately!
|
||||
|
||||
Let me be clear for the smoothest of brains - *in absolutely no way does this method help the short hedge funds reduce their short position.* They are not closing any shorts unless they keep some of the phantom shares in which case they are simply increasing the short position of the Market Maker aka Shitadel. This method only allows them to appear as though they have cleared their current FTD's while resetting the countdown. They then have to do this all over again the next time the FTD timer comes knocking.
|
||||
|
||||
This could be another valuable tell for just how big the short position is! Other methods are being used to reset FTD's, I'm sure, but this method, combined with [/u/dejf2](https://www.reddit.com/u/dejf2/)'s find of just how many of these useless puts were traded gives me a raging clue. This makes me believe that from this method alone, the shorts have created and bought back phantom shares to reset AT LEAST 109 million phantom shares worth of FTD's.
|
||||
|
||||
I hope this catches the eyes of some of some of the more wrinkly brains out there who can read terminal data and helps us get a clearer picture of just how fucked the hedgies truely are. As for me, I am more confident than ever before that the MOASS is inevitable. The tendieman commeth.
|
||||
|
||||
HODL 💎🙌🦍🚀🌝☄️✨🛸
|
||||
|
||||
Edit: tagging [/u/augrr](https://www.reddit.com/u/augrr/), [/u/HomeDepotHank69](https://www.reddit.com/u/HomeDepotHank69/), [/u/broccaaa](https://www.reddit.com/u/broccaaa/) our local FTD guru's to see if this new info can be used in conjunction with their findings on FTD numbers and reset methods that they have written such great DD about already.
|
||||
|
||||
Edit 2: Clarified my conclusion after seeing some good questions in the comments
|
||||
|
||||
*None of the above is financial advice, I just like the stock.*
|
||||
132
DD/2021-05-28-GME-Ownership-Analysis.md
Normal file
132
DD/2021-05-28-GME-Ownership-Analysis.md
Normal file
@ -0,0 +1,132 @@
|
||||
GME Ownership Analysis 5/28- Hedgies R FuQ
|
||||
==========================================
|
||||
|
||||
| Author | Source |
|
||||
| :-------------: |:-------------:|
|
||||
| [u/H3RB28](https://www.reddit.com/user/H3RB28/) | [Reddit](https://www.reddit.com/r/Superstonk/comments/nneevk/gme_ownership_analysis_528_hedgies_r_fuq/) |
|
||||
|
||||
---
|
||||
|
||||
[DD 👨🔬](https://www.reddit.com/r/Superstonk/search?q=flair_name%3A%22DD%20%F0%9F%91%A8%E2%80%8D%F0%9F%94%AC%22&restrict_sr=1)
|
||||
|
||||
Hello fellow Apes,
|
||||
|
||||
Obligatory Disclaimer: I am not a Financial Advisor, and this is not Financial Advice. Always do your own homework. That being said.. lets get started.
|
||||
|
||||
TL,DR: Hedies R FuQ. I used data from FTSE Russell's own Database 'Mergent Online' to calculate the current ownership numbers for GME... and my TITS ARE JACKED.
|
||||
|
||||
I found some very interesting ownership numbers for GME today. I am using Mergent Online as my data source, which is produced by FTSE Russell.. yes the same FTSE Russell that runs the Russell 2000 Index, which GME is *currently* a part of. I have access to Mergent through the university I am currently at while finishing my bachelors in Finance in a few months.
|
||||
|
||||
Now before we get fully started on a simple ownership analysis.. I'm going to take us on a trip back to middle school math class and the dreaded topic of Algebra. Proportions and Cross Multiplying are a pretty simple topic and go something like this:
|
||||
|
||||
[](https://preview.redd.it/mz00tbfuwy171.jpg?width=720&format=pjpg&auto=webp&s=8b5901da8109b43c71e29b3807a9a5637e8fb716)
|
||||
|
||||
Proportions and Cross Multiplication
|
||||
|
||||
For making Ownership calculations we need a base to go off of. Mergent Online (once again information reported by the index that GME is a part of) reports the ownership of GME at the following:
|
||||
|
||||
[](https://preview.redd.it/6io407b6yy171.jpg?width=3634&format=pjpg&auto=webp&s=ea4aaabfb669429f115e1adb79cfdfbb65828caa)
|
||||
|
||||
GME Ownership
|
||||
|
||||
Mergent Online has GME Shares Outstanding as 69,936,000. We need to keep in mind that this is a number reported as of 1/30/2021. Since then, GME has made a secondary offering of 3,500,000 shares. This gives us an Issuer-Stated Total Shares Outstanding of 73,436,000 or 73.436 Million shares.
|
||||
|
||||
Now that we know how many shares there are *supposed* to be, lets check out the Insider Ownership.
|
||||
|
||||
[](https://preview.redd.it/9haw4oug0z171.jpg?width=3622&format=pjpg&auto=webp&s=14a97865a44e6a912bf5246a906f1219fde92345)
|
||||
|
||||
GME Insider Ownership
|
||||
|
||||
We can see that the Insider Ownership is broken into two distinct categories: Direct and Indirect Ownership. Direct Ownership is when the shares are listed *directly* in your name, and not say.. in shelter company like RC Ventures. We will do two different calculations in order to display the situation correctly.
|
||||
|
||||
Mergent lists the Direct Ownership at 8,057,864 shares totaling 11.52% ownership pie (we all like pies). This leaves 88.48% left over.. *but how many shares is that wrinkly brained ape?* Lets put our trusty friend Algebra to the test.
|
||||
|
||||
(11.52/8,057,864) = (88.46/X)
|
||||
|
||||
11.52X=712,798,649.44 .. now to find X we divide each side by 11.52.
|
||||
|
||||
X=61,874,882.76
|
||||
|
||||
Now to check our math we add the 88.46% to the 11.52% to get a total ownership number.
|
||||
|
||||
Previously stated ownership: 69,936,000
|
||||
|
||||
8,057,864 + 61,874,882.76= 69,932,746.76
|
||||
|
||||
To me.. being around 4,000 shares within the "Stated Shares Outstanding" checks out enough to me. To calculate the Free Float I added in the extra 3.5 million shares that were a part of the secondary offering (total shares outstanding 73,436,000)
|
||||
|
||||
This would put GME at a Free Float of 65,378,136 shares.
|
||||
|
||||
BUT APE NO INCLUDE TENDIE MASTER!! I know, we are getting there.
|
||||
|
||||
*RC Ventures WAS NOT listed on the "Direct Ownership" list. The Indirect Ownership is stated at 15,760,670 shares.
|
||||
|
||||
Adding the two 'Insider Ownerships' together gives us the following:
|
||||
|
||||
8,057,864 + 15,760,670 = 23,818,534 for insider ownership
|
||||
|
||||
This new number would give us a Free Float of 49,617,466 or 49 Million shares.
|
||||
|
||||
*Up until this point this is all stuff that we have basically already known.. its about to get a little more spicy.* Next we will cover the Institutional Ownership side. Now the Institutional numbers have always been wacky for GME, but I believe these next calculations provide insight into just how big of a hole hedgies have dug themselves.
|
||||
|
||||
GME Institutional Ownership- As Stated by Mergent FTSE Russell:
|
||||
|
||||
[](https://preview.redd.it/z3kg7s9q5z171.jpg?width=3647&format=pjpg&auto=webp&s=dcd3b4b6e56200b41888ca0102fd80528de62b8e)
|
||||
|
||||
Hedgies R FuQ
|
||||
|
||||
Two things IMMEDIATELY stand out to me: #1 Institutions own 56,158,356 shares.... AT 28.87% ownership.. WHAT?!? This statistic is what is *REPORTED* to the index, these numbers definitely could be fudged.. but most likely to the downside and not the upside.
|
||||
|
||||
*So smart Ape.. if Institutions own 28.87% of GME with 56M shares.. how many shares does everyone else (aka Insiders and Retail) own at 71.13%?* Once again, our friend Algebra comes into play.
|
||||
|
||||
(28.87/56,158,356) = (71.13/X)
|
||||
|
||||
28.87X = 3,994,543,862.28 (now we divide each side by 28.87)
|
||||
|
||||
X= 138,363,140.36 or 138.36M shares.. GO APES!
|
||||
|
||||
If we then subtract out the higher Insider Ownership number (Direct + Indirect) this gives us a *Retail Control* of 114,544,606.36 shares or 114 MILLION SHARES.
|
||||
|
||||
*What the Fuq did hedgies get themselves into?!?*
|
||||
|
||||
Now according to the "Institutional Ownership" numbers I wanted to see around about how many Naked Shorts the firms had rehypothecated. To get the Total Shares Outstanding we would then add Institutional Ownership with Retail and Insider Ownership stats:
|
||||
|
||||
56,158,356 + 138,363,140 = 194,521,496 shares.. 194 million fuqing shares.
|
||||
|
||||
So with the institutional numbers and the Issuer stated numbers I came to the conclusion that:
|
||||
|
||||
194,521,496 - 73,436,000 = 121,085,496 or 121 MILLION SHARES NAKED
|
||||
|
||||
What did Kenny get himself into.. well covering 121 MILLION shares he can't get his hands on because 114 MILLION are in the hands of Apes.
|
||||
|
||||
*Please keep in mind these are the reported numbers.. they could truly be MUCH higher.*
|
||||
|
||||
I am always open to criticisms and questions/discussion.
|
||||
|
||||
Be Excellent and Rock on Fellow Apes.
|
||||
|
||||
- H3RB
|
||||
|
||||
Edit: Here is the screen shot from above with the dates highlighted for the base calculations:
|
||||
|
||||
[](https://preview.redd.it/tr50evybjz171.jpg?width=3354&format=pjpg&auto=webp&s=8e1f8f284ff23268916cabf08369388a8b1947bd)
|
||||
|
||||
Edit 2: Full Screen Shots of Institutional Ownership Stats:
|
||||
|
||||
[](https://preview.redd.it/nwicrfepoz171.png?width=3693&format=png&auto=webp&s=473fcf5d17515aa04e6c6cc8150696426c04bba5)
|
||||
|
||||
Institutional Ownership 1
|
||||
|
||||
[](https://preview.redd.it/dia9iacsoz171.png?width=3644&format=png&auto=webp&s=364688f6593f56bf6726ec2a440c2cc0b41877f5)
|
||||
|
||||
Institutional Ownership 2
|
||||
|
||||
Edit 3: Direct vs. Indirect Insider Ownership RC Listed as Indirect
|
||||
|
||||
[](https://preview.redd.it/oz019rwsxz171.jpg?width=3668&format=pjpg&auto=webp&s=861b89415e9b82028514b010ad6e0be7189705e1)
|
||||
|
||||
RC Listed as Indirect
|
||||
|
||||
EDIT 4 (5/29 afternoon): I am doing a more comprehensive review of ownership comparing the numbers reported by Mergent and FTSE Russell to those of: GameStop Proxy, Yahoo Finance Premium, FinteliO, Whale Wisdom, Koyfin, Fidelity Research, Nasdaq, CNNMoney, and MarketBeat (I think I named them all.. may be more I'll update as needed). I am trying to match numbers to see if I can find any discrepancies in data reported.
|
||||
|
||||
I have also contacted Mergent & FTSE Russell to try and see if I can get any information on *how* they source their information. On their website it states they have a dedicated data team that updates the data live daily from multiple market sources. I am not sure how true this is, but in the data columns it did say "as of 5/28/21". I will updated on any information about data sources that I receive.
|
||||
@ -0,0 +1,130 @@
|
||||
Learn from the past, when they didn't care to hide.
|
||||
==================================================
|
||||
|
||||
| Author | Source |
|
||||
| :-------------: |:-------------:|
|
||||
| [u/JustBeingPunny](https://www.reddit.com/user/JustBeingPunny/) | [Reddit](https://www.reddit.com/r/Superstonk/comments/nyxs1f/learn_from_the_past_when_they_didnt_care_to_hide/) |
|
||||
|
||||
---
|
||||
|
||||
[DD 👨🔬](https://www.reddit.com/r/Superstonk/search?q=flair_name%3A%22DD%20%F0%9F%91%A8%E2%80%8D%F0%9F%94%AC%22&restrict_sr=1)
|
||||
|
||||
Have you heard of Max-D? No, nor had I. I searched for 'naked short selling' through EDGAR (SEC's public database' and amongst all of the filings, I stumbled upon their wonderful little company.
|
||||
|
||||
What makes them so special? Why even bother with a post? Well, they were subjected to manipulative stock trading that was driving their share price into the ground, much like the attempt on GameStop. However, like overstock, this company fought back hard. The went public to expose the naked short selling with figures and number to prove just how bad it was.
|
||||
|
||||
Rather than a long TL;DR at the end, I'll be posting recap summaries throughout. You should be able to follow the entire post reading these summaries... I hope. The whole thing is a good read, I promise!
|
||||
|
||||
*As always, if any information or interpretation is incorrect, help me correct it! I'm happy to edit accordingly!*
|
||||
|
||||
_______________________________________________________________________________
|
||||
|
||||
Background --
|
||||
|
||||
June 14, 2018 -- 19.09pm ET
|
||||
|
||||
*Max Sound Corporation (OTC:MAXD) and its Shareholders are being continuously victimized by Manipulative Trading Practices and Abusive Naked Short Selling orchestrated by Knight/Virtu (NITE), Cantor Fitzgerald (CANT), Canaccord Genuity (CSTI),* *Citadel* *(CDEL) and eTrade/G1 (ETRF) for the past three years with the objective to systematically lower the MAXD share price by selling billions of counterfeit shares that generate enormous free money for the market makers who have no intention of ever covering a short position. In fact, they have paid bashers that spew lies and libel wherever legitimate shareholders congregate.*
|
||||
|
||||
*Yesterday the Company reported that it had engaged a leading provider of Regulation SHO compliance monitoring, short sale trading statistics and market integrity surveillance related to substantial naked short selling of its stock.*
|
||||
|
||||
*Max Sound has now registered complaints related to these activities with the Securities and Exchange Commission (SEC) and Financial Industry Regulatory Authority (FINRA).* *The Company encourages MAXD investors and shareholders who believe they have been harmed, to file complaints as well. Remember, the value is being stolen from your investment, only because well-organized criminals are able to operate with absolute power, unmonitored inside the industry that handles, manages, trades and ultimately steals the total value of your asset.*
|
||||
|
||||
This is a direct statement. The gigantic titanium swingers these mofos have. I guess I'm not surprised Citadel are in there. Though things continue to get REALLY interesting...
|
||||
|
||||
June 14, 2018 -- Earlier the same morning -- 08.49 ET
|
||||
|
||||
*Max Sound Corporation has engaged a leading provider of Regulation SHO compliance monitoring, short sale trading statistics and market integrity surveillance related to substantial short selling of its stock. Regulation SHO requires bona-fide market-making activities to include making purchases and sales in roughly comparable amounts.*
|
||||
|
||||
So you're being naked shorted right into the ground. You feel helpless and have nowhere to go. What do you do? You bring in the experts and that is exactly what they did.
|
||||
|
||||
*The Securities and Exchange Commission has stated that bona-fide market-making DOES NOT include activity that is related to speculative selling strategies for investment purposes of the broker-dealer and is disproportionate to the usual market making patterns or practices of the broker-dealer in that security. Likewise, where a market maker posts continually at or near the best offer, but does not also post at or near the best bid, the market maker's activities do not qualify as bona-fide market making. Moreover, a market maker that continually executes short sales away from its posted quotes is not considered to be engaged in bona-fide market making*
|
||||
|
||||
Ape talk -- The SEC has stated market-making can't be genuine if they're 'shorting away from its' posted quotes', missing bids from the buy side every now and then, whilst the sell side ALWAYS has something there, or diverts away from its' regular market making patterns. (Sound familiar?) *This is my interpretation. My knowledge on market making is little, so if anyone can add a better easy explanation, I'll be happy to add.*
|
||||
|
||||
So let's take a break here and recap.
|
||||
|
||||
MAXD are a company that were fully aware that they were being shorted (also naked) into the ground. They hired some experts in the field to take a look into the trading and market making activities for compliance. What they found was....
|
||||
|
||||
_______________________________________________________________________________________________________________________
|
||||
|
||||
Did they comply?
|
||||
|
||||
*MAXD market makers have been monitored daily for compliance with Reg SHO and Fair Market-Making Requirements.* *Here is a trading analysis of MAXD.*
|
||||
|
||||
*BuyVol = real buyers at offer.*
|
||||
|
||||
*SellVol = real sellers at bid.*
|
||||
|
||||
*ShortVolume = short sale trade identifiers for both EXEMPT (market makers)*
|
||||
|
||||
*NON-EXEMPT (everyone else) shorts sales.*
|
||||
|
||||
*The short selling as a percentage of daily trading volume in MAXD by your firm is abnormally high; the market-making math related thereto does not reconcile and is not at all compliant with Federal Securities Laws***.**
|
||||
|
||||
*As is common during these orchestrated short selling campaigns, bad actors with no real interest in MAXD's success, or any small public company for that matter,* *has consistently engaged in false accusations and libel on the Company's stock chat boards in attempts to scare and demoralize MAXD's legitimate shareholders**. It is noteworthy that as soon as Max Sound sent this report to the market makers perpetrating the naked short sales on the company, the bad actors disappeared at least for the time being..*
|
||||
|
||||
Acknowledging the shills, reporting the shills and then telling the shorts that they know. I'm beginning to love these people more and more.
|
||||
|
||||
Recap -- The experts took a peek behind the curtain and did the math on the market making activity. They concluded that there was absolutely no way that they could be complying with federal securities law. They also found shills in their message boards and compiled a report highlighting all of this. This forced the shorts to back off for a small while.
|
||||
|
||||
__________________________________________________________________________________________________________________________
|
||||
|
||||
The data
|
||||
|
||||
This is the thick of it. MAX-D just didn't publicly state all of this was happening. They posted clear numbers detailing how and WHO. *I'll continue to quote their statement and break it down further. Buckle up.*
|
||||
|
||||
*We have analyzed the last year of daily short volume data and correlated it to recent market making activity in MAXD.* *In 27 of the past 31 trading days, 87% of the time, the combined selling and short selling in MAXD has far exceeded the amount of buying (See NetNet column below).* *Market makers, by definition, are required to PROVIDE LIQUIDITY not extract or remove liquidity**. The math provided below demonstrates that instead of matching orders, market makers, Knight/Virtu, Cantor Fitzgerald, Canaccord Genuity, Citadel, eTrade/G1 are heavily shorting MAXD stock BOTH on the offer and on the bid, which by definition means they have a "speculative short selling strategy" running on MAXD. They are carrying net short positions overnight and continuing to claim the market maker's exemption, which is in VIOLATION of the Fair Market Making Requirements of Regulation SHO.* *We are able to mathematically prove this because there is not enough BuyVol (buy volume) to match the amount of selling and short selling. The chart below identifies the top 5 market makers, in MAXD for May 2018 (highlighted below) accounting for 2,257,870,595 shares of trading, or 88.22% of total trading volume in May.*
|
||||
|
||||
Ape talk/Recap -- There was lots and lots of short selling from many market makers. They continually claimed their exemption to naked short sell, which is a violation of regulation SHO. Better yet, they could mathematically prove it...
|
||||
|
||||
*Total Volume* *Name*
|
||||
|
||||
*(Last Month)*
|
||||
|
||||
*643,662,180* *Knight/Virtu,*
|
||||
|
||||
*154,447,100* *Cantor Fitzgerald,*
|
||||
|
||||
*203,762,081* *Canaccord Genuity,*
|
||||
|
||||
*769,731,954* *Citadel, - These fuckers yet again*
|
||||
|
||||
*247,276,817* *Trade/G1*
|
||||
|
||||
*Highlighting these Market Makers abusive activities in-concert with each other for just the one month of May, allows regulators, the SEC, FINRA, the U.S. Attorney as well as the media to easily identify the manipulative trading activity and counterfeiting of MAXD shares engaged in by their traders for the past year and well beyond. When overlaid for the entire year (back to June 1, 2017) the math is shocking. 8,117,878,650 total shares have been shorted representing in excess of 40% of MAXD's total trading volume and it demonstrates that these market makers have knowingly participated in manipulative trading practices and counterfeiting of MAXD shares.*
|
||||
|
||||
We provide the following data in this report:
|
||||
|
||||
DAILY TOTAL SHARES SHORTED (volume and price), which includes all shares shorted even by exempt institutions such as market makers.
|
||||
|
||||
FAILURES TO DELIVER (naked shorts).
|
||||
|
||||
MARKET MAKER SHARE VOLUME (exposing exactly how many shares are being traded and the name of the market making firm traded through).
|
||||
|
||||
MARKET MAKER DATA (showing whether or not a fair market is being made in each trading day).
|
||||
|
||||
CUMULATIVE TOTAL SHARES SHORTED data showing large short positions and the volume weighted average price that a short squeeze will start.
|
||||
|
||||
[](https://preview.redd.it/xlb7iptlo1571.png?width=568&format=png&auto=webp&s=4f83254f4d02b5f4996ab05191a6937bc1cc1b73)
|
||||
|
||||
[](https://preview.redd.it/kdft08vmo1571.png?width=555&format=png&auto=webp&s=ec83f53d39b609f687ef86a37103320504121f3e)
|
||||
|
||||
Recap -- They proved mathematically that the game was rigged and that Kenny boy (Citadel) was the biggest culprit. The first image shows the potential squeeze value. The second image shows just how bad the market making activity was. Just look at that buy volume vs sell volume.
|
||||
|
||||
________________________________________________________________________________________________________________________
|
||||
|
||||
The final comment
|
||||
|
||||
*MAXD is making this report available to the investment world to create a substantial short squeeze opportunity with the goal to return to its shareholders the massive amount of equity stolen by unscrupulous market makers.*
|
||||
|
||||
They openly advocated for people to invest to start a short squeeze. There was no hidden riddle. It was there in black and white.
|
||||
|
||||
TL;DR -- MAX-D are a company that were being shorted into the ground. Market makers were using their liquidity exemptions to naked short, further driving the price. MAX-D brought in the experts and found the market making activity was fraudulent and in breach of Federal securities law, as it was mathematically impossible they were doing everything 'by the book'.
|
||||
|
||||
_______________________________________________________________________________________________________________________________
|
||||
|
||||
Bonus round -- Citadel and the inadvertent 'mini bomb'
|
||||
|
||||
Let's look at the chart. Citadel were the biggest shorts for the company? Looks like Kenny had to cover some of them other shorts positions.
|
||||
|
||||
[](https://preview.redd.it/b2sv9zxto1571.png?width=672&format=png&auto=webp&s=7e5bf6e1aecffc9b61ab9dcad35a16d87246a691)
|
||||
252
DD/2021-06-16-T+35-is-the-One-True-Cycle.md
Normal file
252
DD/2021-06-16-T+35-is-the-One-True-Cycle.md
Normal file
@ -0,0 +1,252 @@
|
||||
T+35 is the one true "cycle" [Evidence to back my theory up plus a step-by-step guide on how to follow along at home]
|
||||
=====================================================================================================================
|
||||
|
||||
| Author | Source |
|
||||
| :-------------: |:-------------:|
|
||||
| [u/dentisttft](https://www.reddit.com/user/dentisttft/) | [Reddit](https://www.reddit.com/r/Superstonk/comments/o155a6/t35_is_the_one_true_cycle_evidence_to_back_my/) |
|
||||
|
||||
---
|
||||
|
||||
[DD 👨🔬](https://www.reddit.com/r/Superstonk/search?q=flair_name%3A%22DD%20%F0%9F%91%A8%E2%80%8D%F0%9F%94%AC%22&restrict_sr=1)
|
||||
|
||||
*This post is for educational purposes only. Do your own research and make your own decisions before acting on them. Just because this information is correct now, doesn't mean it will be correct every other day. HFs have a lot of tricks. No one knows what will come next...*
|
||||
|
||||
EDIT10 (6/21): It is more clear to me now that ETF FTD's do not behave the same as the GME FTDs that I use as examples. The ETF FTDs are a work in progress. The ETF FTDs should be weighted as well. If you find a pattern in the ETF FTDs, I'm open to hearing it!
|
||||
|
||||
--------------------------------------------------------------------------------------
|
||||
|
||||
TL;DR:
|
||||
|
||||
- Every spike that is seen can be traced back to T+35.
|
||||
|
||||
- I show 1 min spikes to back this claim up
|
||||
|
||||
- I provide a guide on how to setup this data yourself.
|
||||
|
||||
Preface
|
||||
|
||||
Almost 2 weeks ago, I posted some DD about T+35.
|
||||
|
||||
[T+21 is NOT actually a thing! [Counter DD]](https://www.reddit.com/r/Superstonk/comments/nsady3/t21_is_not_actually_a_thing_counter_dd/)
|
||||
|
||||
I claim that T+35 is the only T+X that is important, and other T+X "cycles" are actually just from T+35. This concept goes against the general consensus, so as expected... I got mixed reviews. Since then I have seen a different T+X, T+Y, T+Z theory every day, but there is always a catch or some sort of guessing applied. Or the cycle is T+21 one month, but T+19 the other month. As you may imagine, this has gotten frustrating for me. There is no shade being thrown at other DD writers. I just want everyone to realize how simple this is so we can all be on the same page.
|
||||
|
||||
My T+35 theory doesn't have guess work. It works every time and it's based on free data that anyone can get. In this post, I will show you how. (I know this is starting to sound like an infomercial, but stick with me)
|
||||
|
||||
Where my T+35 theory comes from...
|
||||
|
||||
Reg SHO Rule 204 (<https://www.law.cornell.edu/cfr/text/17/242.204>) states HFs need to cover their FTDs "before regular trading hours on the 35th day after the FTD date". My T+35 theory shows they wait until the last possible day to cover, so the 34th day after the FTD date (this is why our third column formula was "=A1 + 34"). If the 34th day lands on a weekend or holiday, bump it forward to the next business day.
|
||||
|
||||
Reg SHO states that you cannot short a stock if you have FTDs open. Once the FTDs get covered on that day, GME's price will not return to that point.
|
||||
|
||||
That's it. That's all you need.
|
||||
|
||||
It's as simple as...
|
||||
|
||||
1. Get the FTD data
|
||||
|
||||
2. Count 34 calendar days (FTDs need to be covered BEFORE the 35th day)
|
||||
|
||||
3. Those FTDs will be bought all at once on that trading day.
|
||||
|
||||
Oh, you want to see an example?
|
||||
|
||||
Okay, sure.
|
||||
|
||||
I have picked out days from April because the FTDs are large and the volume was small. It is very easy to pick them out.
|
||||
|
||||
How about... April 21. 32,220 FTDs need to be covered. The day's volume was low, but there was a 1m volume spike at 12:23 EST of 39,000. GME's price never came back afterward.
|
||||
|
||||
[![r/Superstonk - T+35 is the one true "cycle" [Evidence to back my theory up plus a step-by-step guide on how to follow along at home]](https://preview.redd.it/c82wf7csqm571.png?width=451&format=png&auto=webp&s=ca4a553ffb37e4eb7ef574f3bdd7efc21bbcd413)](https://preview.redd.it/c82wf7csqm571.png?width=451&format=png&auto=webp&s=ca4a553ffb37e4eb7ef574f3bdd7efc21bbcd413)
|
||||
|
||||
[![r/Superstonk - T+35 is the one true "cycle" [Evidence to back my theory up plus a step-by-step guide on how to follow along at home]](https://preview.redd.it/stvi493tqm571.png?width=760&format=png&auto=webp&s=c63c88a3ef43b64a79c124bf49fc0aaff0057ec9)](https://preview.redd.it/stvi493tqm571.png?width=760&format=png&auto=webp&s=c63c88a3ef43b64a79c124bf49fc0aaff0057ec9)
|
||||
|
||||
April 19. 140,554 FTDs need to be covered. GME was rising quite fast on it's own. Remember, they can't short a stock when they have FTDs that need to be covered. So at 10:25 EST, There was a big jump in volume up to 160k and then the price dropped for the rest of the day.
|
||||
|
||||
[![r/Superstonk - T+35 is the one true "cycle" [Evidence to back my theory up plus a step-by-step guide on how to follow along at home]](https://preview.redd.it/lb5q8rbvqm571.png?width=449&format=png&auto=webp&s=6fa055c19c2cf90d9cd6c8bddd1c201c5d5d1543)](https://preview.redd.it/lb5q8rbvqm571.png?width=449&format=png&auto=webp&s=6fa055c19c2cf90d9cd6c8bddd1c201c5d5d1543)
|
||||
|
||||
[![r/Superstonk - T+35 is the one true "cycle" [Evidence to back my theory up plus a step-by-step guide on how to follow along at home]](https://preview.redd.it/px47llyvqm571.png?width=805&format=png&auto=webp&s=e344df65f5219edef1d3f7708357a728c5793130)](https://preview.redd.it/px47llyvqm571.png?width=805&format=png&auto=webp&s=e344df65f5219edef1d3f7708357a728c5793130)
|
||||
|
||||
You see? It's that easy!
|
||||
|
||||
Meh... this seems like a coincidence
|
||||
|
||||
Okay, fine... I'll keep going.
|
||||
|
||||
April 16 - 46,344 FTDs
|
||||
|
||||
[![r/Superstonk - T+35 is the one true "cycle" [Evidence to back my theory up plus a step-by-step guide on how to follow along at home]](https://preview.redd.it/cmrtpjd1rm571.png?width=449&format=png&auto=webp&s=feaf916cbd63dffe35c043ca34ffeebfb81ee19d)](https://preview.redd.it/cmrtpjd1rm571.png?width=449&format=png&auto=webp&s=feaf916cbd63dffe35c043ca34ffeebfb81ee19d)
|
||||
|
||||
[![r/Superstonk - T+35 is the one true "cycle" [Evidence to back my theory up plus a step-by-step guide on how to follow along at home]](https://preview.redd.it/3f8jcft1rm571.png?width=805&format=png&auto=webp&s=89bad926ace29cb36dfb23cfed018e78e642e653)](https://preview.redd.it/3f8jcft1rm571.png?width=805&format=png&auto=webp&s=89bad926ace29cb36dfb23cfed018e78e642e653)
|
||||
|
||||
April 15 - 155,658 FTDs
|
||||
|
||||
[![r/Superstonk - T+35 is the one true "cycle" [Evidence to back my theory up plus a step-by-step guide on how to follow along at home]](https://preview.redd.it/n75at1i4rm571.png?width=448&format=png&auto=webp&s=5b314710aa16ba499713776eccf36306c5826688)](https://preview.redd.it/n75at1i4rm571.png?width=448&format=png&auto=webp&s=5b314710aa16ba499713776eccf36306c5826688)
|
||||
|
||||
[![r/Superstonk - T+35 is the one true "cycle" [Evidence to back my theory up plus a step-by-step guide on how to follow along at home]](https://preview.redd.it/rjz3cpw4rm571.png?width=758&format=png&auto=webp&s=a027c39558f072760bb8c02bc2601580da764abc)](https://preview.redd.it/rjz3cpw4rm571.png?width=758&format=png&auto=webp&s=a027c39558f072760bb8c02bc2601580da764abc)
|
||||
|
||||
April 1 - Two days needed to be covered this day because 4/4 was a weekend. At 1:25, there was an 83k volume spike followed by a couple 100k-150k volume candles.
|
||||
|
||||
[![r/Superstonk - T+35 is the one true "cycle" [Evidence to back my theory up plus a step-by-step guide on how to follow along at home]](https://preview.redd.it/dtcgi377rm571.png?width=449&format=png&auto=webp&s=04879f53d128e51679420c3c9acd23be166d06dc)](https://preview.redd.it/dtcgi377rm571.png?width=449&format=png&auto=webp&s=04879f53d128e51679420c3c9acd23be166d06dc)
|
||||
|
||||
[![r/Superstonk - T+35 is the one true "cycle" [Evidence to back my theory up plus a step-by-step guide on how to follow along at home]](https://preview.redd.it/hjktf658rm571.png?width=763&format=png&auto=webp&s=eb96ccede1210db6c24950eeb0f689db122b6f99)](https://preview.redd.it/hjktf658rm571.png?width=763&format=png&auto=webp&s=eb96ccede1210db6c24950eeb0f689db122b6f99)
|
||||
|
||||
April 30 - 86,859 FTDs. This one got split between two minutes on my chart. The average 1m volume was between 30k-40k shares. And then there are two 70k-80k volume candles at 9:50-9:51 am.
|
||||
|
||||
[![r/Superstonk - T+35 is the one true "cycle" [Evidence to back my theory up plus a step-by-step guide on how to follow along at home]](https://preview.redd.it/vezj8zkarm571.png?width=453&format=png&auto=webp&s=06957bcdbaeeaa47ba59f34382e1811182c2b07a)](https://preview.redd.it/vezj8zkarm571.png?width=453&format=png&auto=webp&s=06957bcdbaeeaa47ba59f34382e1811182c2b07a)
|
||||
|
||||
[![r/Superstonk - T+35 is the one true "cycle" [Evidence to back my theory up plus a step-by-step guide on how to follow along at home]](https://preview.redd.it/fb1lqpyarm571.png?width=855&format=png&auto=webp&s=238276a529cc1e48c34e06e58e9bce7b3a817843)](https://preview.redd.it/fb1lqpyarm571.png?width=855&format=png&auto=webp&s=238276a529cc1e48c34e06e58e9bce7b3a817843)
|
||||
|
||||
I can keep going. These are the easy ones to spot *just* in April.
|
||||
|
||||
So what about ETF FTDs?
|
||||
|
||||
Days with large ETF FTDs also see spikes like this. But it doesn't convert well enough to show. For instance, 1.9 million ETF FTDs might convert to a 120,000 share GME spike. If someone wants to continue this research and find a way to convert the ETF FTD count into GME shares, go ahead.
|
||||
|
||||
Why do some days lead to large gains and some days drop immediately after the FTD cover?
|
||||
|
||||
I wrote about that in my last DD:
|
||||
|
||||
[SLD DD [A predictable monthly pinch on capital leading to GME gains]](https://www.reddit.com/r/Superstonk/comments/nz7mwl/sld_dd_a_predictable_monthly_pinch_on_capital/)
|
||||
|
||||
But here's what you need to know if you can't read two DDs in a row:
|
||||
|
||||
- There is a period that starts on Wednesday before monthly options expiration and extends to 9 days after monthly options expiration where the 30 largest financial companies need to make large deposits to the NSCC.
|
||||
|
||||
- During those days, they have less money and need to be careful not to spend more or they will get liquidity called.
|
||||
|
||||
- Meaning T+35's with large FTD days that fall in the SLD period will increase GME's price a lot more than large FTD days that fall out of the SLD period. Once the price of GME rises within the SLD period, it does not come back down until 2 days before the end of SLD.
|
||||
|
||||
I even mapped out the SLD periods:
|
||||
|
||||
[![r/Superstonk - T+35 is the one true "cycle" [Evidence to back my theory up plus a step-by-step guide on how to follow along at home]](https://preview.redd.it/ys4ovwzurm571.png?width=1246&format=png&auto=webp&s=16a4fcd208abfca25a479f87f5f54fc590b2af06)](https://preview.redd.it/ys4ovwzurm571.png?width=1246&format=png&auto=webp&s=16a4fcd208abfca25a479f87f5f54fc590b2af06)
|
||||
|
||||
March 5-10 is the biggest spike outside of SLD. Those can be associated with ETF FTDs.
|
||||
|
||||
[![r/Superstonk - T+35 is the one true "cycle" [Evidence to back my theory up plus a step-by-step guide on how to follow along at home]](https://preview.redd.it/enpanyhxrm571.png?width=448&format=png&auto=webp&s=3c9b8bb8bb070fe3283ecdb7874e7e94eb283339)](https://preview.redd.it/enpanyhxrm571.png?width=448&format=png&auto=webp&s=3c9b8bb8bb070fe3283ecdb7874e7e94eb283339)
|
||||
|
||||
How do I see this for myself?
|
||||
|
||||
Download the FTD data from the SEC: <https://www.sec.gov/data/foiadocsfailsdatahtm> and pull out every line with GME and every line of the ETFs GME are in. But that's a lot of work. Luckily, a lovely ape by the name of [u/nequin](https://www.reddit.com/u/nequin/) made a website to do this all for you.
|
||||
|
||||
Get the FTD data:
|
||||
|
||||
1. Go to <https://failedtodeliver.com/?symbols=GME>
|
||||
|
||||
2. Make a spreadsheet.
|
||||
|
||||
1. Column A is the FTD date.
|
||||
|
||||
2. Column B is "=A1+34" and fill down.
|
||||
|
||||
3. Column C is the number of GME FTDs
|
||||
|
||||
4. Column D is the number of ETF FTDs
|
||||
|
||||
ETFs with GME
|
||||
|
||||
<https://failedtodeliver.com/?symbols=GAMR,XRT,RETL,XSVM,VIOV,RWJ,VIOO,PSCD,VIOG,VTWV,IUSS,VCR,VTWO,SFYF,IWC,EWSC,SYLD,PRF,RALS,FNDX,FNDB,VBR,IJS,XJR,NUSC,SLYV,IJR,SPSM,SLY,FLQS,IJT,GSSC,SLYG,VXF,NVQ,IWN,ESML,VB,SAA,DMRS,BBSC,OMFS,FDIS,STSB,SSLY,IWM,SCHA,PBSM,UWM,VTHR,URTY,VTI,TILT,VLU,HDG,AVUS,MMTM,DSI,SPTM,IWV,SCHB,ITOT,DFAU>
|
||||
|
||||
EDIT 7: I posted my dataset for the people who want to compare. <https://www.reddit.com/user/dentisttft/comments/o1k5s4/t35_dataset/>
|
||||
|
||||
EDIT 9: There were some issues brought up in the data. But they shouldn't be issues. Trust the files or [failedtodeliver.com](https://failedtodeliver.com/), they are the same.
|
||||
|
||||
~~EDIT 6: IT HAS BEEN BROUGHT TO MY ATTENTION THAT THE WEBSITE IS OFF BY ONE DAY STARTING IN APRIL. PROBABLY BECAUSE OF THE HOLIDAY. I HAVE TAGGED THE PERSON WHO CREATED IT. SO MAKE SURE YOU DOUBLE CHECK SOME DAYS WITH THE FILES UNTIL ITS FIXED.~~
|
||||
|
||||
~~EDIT 8: APPARENTLY THE WEBSITE USES THE FILES, SO EDIT 6 IS NOT COMPLETELY CORRECT. THERE IS A DISCREPENCY BETWEEN THE FILES/FAILEDTODELIVER.COM AND THE SEC'S FTD GRAPH.~~ [~~https://sec.report/fails.php?tc=gme~~](https://sec.report/fails.php?tc=gme)
|
||||
|
||||
~~THE FILES SKIP APRIL 21 (WHICH IN MY OPINION MEANS ZERO) AND HAVE APRIL 30, THE GRAPH WEBSITE HAS APRIL 21 AND SKIPS APRIL 30. SO I THINK THE GRAPH WEBSITE MIGHT BE INCORRECT.~~
|
||||
|
||||
Important Notes:
|
||||
|
||||
- Column A is the settlement date when the share officially becomes an FTD.
|
||||
|
||||
- Column B is the last possible day to cover the FTD
|
||||
|
||||
Your spreadsheet looks like this...
|
||||
|
||||
[![r/Superstonk - T+35 is the one true "cycle" [Evidence to back my theory up plus a step-by-step guide on how to follow along at home]](https://preview.redd.it/ox473wz4sm571.png?width=451&format=png&auto=webp&s=0efc2bda56da1c16e3ab3ea4887db568cdbf43b8)](https://preview.redd.it/ox473wz4sm571.png?width=451&format=png&auto=webp&s=0efc2bda56da1c16e3ab3ea4887db568cdbf43b8)
|
||||
|
||||
Now what?
|
||||
|
||||
1. Google search "what is today's date"
|
||||
|
||||
2. Find that date in column 2 (the +34 day)
|
||||
|
||||
3. Follow this flow chart.
|
||||
|
||||
[![r/Superstonk - T+35 is the one true "cycle" [Evidence to back my theory up plus a step-by-step guide on how to follow along at home]](https://preview.redd.it/4ag11hd7sm571.png?width=292&format=png&auto=webp&s=7fc674526dbcd541c60490e9661581559fadade3)](https://preview.redd.it/4ag11hd7sm571.png?width=292&format=png&auto=webp&s=7fc674526dbcd541c60490e9661581559fadade3)
|
||||
|
||||
In my experience, a "large number of FTDs" is 70,000+ for GME FTDs or 1-1.5 million FTDs for ETFs.
|
||||
|
||||
Again, this is not guaranteed. This is just based on patterns I've seen. There are plenty of tricks that probably have not been shown. Don't do something stupid based on this data, its for education purposes only.
|
||||
|
||||
Should my tits be jacked!?
|
||||
|
||||
Here's the new data for this next week... Use your new knowledge from this post and you decide!
|
||||
|
||||
[![r/Superstonk - T+35 is the one true "cycle" [Evidence to back my theory up plus a step-by-step guide on how to follow along at home]](https://preview.redd.it/6a5dvr1jxn571.png?width=597&format=png&auto=webp&s=cc76d854e680a88d218b11774b70e0b805276687)](https://preview.redd.it/6a5dvr1jxn571.png?width=597&format=png&auto=webp&s=cc76d854e680a88d218b11774b70e0b805276687)
|
||||
|
||||
EDIT5: Fixed the hightlighted section. Accidentally had June 15th in there when it shouldn't be.
|
||||
|
||||
FAQ
|
||||
|
||||
New FTD data just came out yesterday. So what about June?
|
||||
|
||||
The ETF FTDs are quite large for the next 5-7 trading days. Combine that with SLD starting on June 16 ~~17~~, things look good.
|
||||
|
||||
EDIT5: Accidentally had the wrong date typed here and the wrong dates highlighted in the photo.
|
||||
|
||||
Why do the last two days of SLD not behave the same as the other days?
|
||||
|
||||
Not sure. My guess is that HFs have 2 days to pay a liquidity call. So there's no point in liquidity calling them when they are about to get their money back. It also usually is at the end of the week when option premiums get extremely high, less calls are bought, and gamma ramp slows down.
|
||||
|
||||
How long does it take before GME/ETFs show up as FTDs?
|
||||
|
||||
They become FTDs when the trade settles. So for GME FTDs, its T+2. For ETF's, its T+6. (shoutout to [u/karasuuchiha](https://www.reddit.com/u/karasuuchiha/) for pointing out the ETF settlement time to me)
|
||||
|
||||
What causes GME FTDs?
|
||||
|
||||
This is where the idea of "cycles" comes from. When FTDs fall in SLD and GME spikes, it creates a lot of ITM call options. When those call options are exercised on Friday, they become FTDs upon settling (T+2 settlement). *Note: Buying and selling option contracts settle in T+1, but exercising contracts is T+2*. This causes a lot of new FTDs that need to be covered in 34 more days. Thus creating an obsession with "cycles" and why other "T+X cycle" theories fall short. It's literally just ITM options from the last SLD + FTD spike price increase will create new FTDs on Tuesday (or Wednesday with a holiday).
|
||||
|
||||
What causes ETF FTDs?
|
||||
|
||||
SSR!!! Remember all those days when SSR didn't stop GME from going down? It's because GME is shorted through the ETFs causing ETF FTDs 6 days later when they settle. It did something, it's just not immediately seen.
|
||||
|
||||
I'm still not buying it. There are definitely spikes every 21 days!
|
||||
|
||||
Well, I tried. Erase what you know about T+21 cycles and try to understand and apply this post. And maybe you will eventually see what I see.
|
||||
|
||||
What about Net Capital?
|
||||
|
||||
I don't know. I avoid FINRA things because in the end... it's just FINRA. This is based off of NSCC rules. I've found enough correlation in only using FTDs and SLD that I didn't think I needed to look into Net Capital too much. They could definitely both be happening, but in the end, I don't think it's too important. I'm open to someone changing my mind on this if you can show me the data (not the rules) to support that Net Capital has more correlation than SLD.
|
||||
|
||||
What else should I know?
|
||||
|
||||
Rule 204 says the 35 day exception applies when you have a long position on the stock. If they're shorting, how do they get to say they have a long position? I have a theory, but nothing concrete.
|
||||
|
||||
TL;DR: The TL;DR is at the top of the post you sweet, tender, smooth-brained ape.
|
||||
|
||||
Now that I have more eyes on my posts, I'm hoping this theory sticks better than the first time. In my opinion, getting distracted on other types of cycles is diluting focus.
|
||||
|
||||
pce~~
|
||||
|
||||
[u/dentisttft](https://www.reddit.com/u/dentisttft/)
|
||||
|
||||
----------------------------------------
|
||||
|
||||
Shoutout to [u/wJFq6aE7-zv44wa__gHq](https://www.reddit.com/u/wJFq6aE7-zv44wa__gHq/) for letting me bounce ideas off of them!
|
||||
|
||||
EDIT1-3: formatting fixes
|
||||
|
||||
EDIT4: Added "Should my tits be jacked!?" section
|
||||
|
||||
EDIT5: Fixed the dates on my new section. I rushed it and highlighted June 15 on accident.
|
||||
|
||||
Bonus Round!
|
||||
|
||||
I posted my SLD DD on June 13th at 6:23 PM EST. 6 hours later at 12:02, Elon Musk posted this on Twitter.
|
||||
|
||||
[![r/Superstonk - T+35 is the one true "cycle" [Evidence to back my theory up plus a step-by-step guide on how to follow along at home]](https://preview.redd.it/83o4bvpgsm571.png?width=616&format=png&auto=webp&s=4527094e5aa1d136adabc4dd554778ac29b5590c)](https://preview.redd.it/83o4bvpgsm571.png?width=616&format=png&auto=webp&s=4527094e5aa1d136adabc4dd554778ac29b5590c)
|
||||
|
||||
Is it about my DD? No idea, probably not. But it's fun to think about. If any of the RC Tweet analyzers can find a definite connection, that would make my day.
|
||||
68
DD/2021-07-04-Is-the-Bubble-Bursting.md
Normal file
68
DD/2021-07-04-Is-the-Bubble-Bursting.md
Normal file
@ -0,0 +1,68 @@
|
||||
Is the bubble bursting? It's all connected. GME will moon one way or another.
|
||||
=============================================================================
|
||||
|
||||
| Author | Source |
|
||||
| :-------------: |:-------------:|
|
||||
| Saved by [u/chanunnaki](https://www.reddit.com/user/chanunnaki/) | [Reddit](https://web.archive.org/web/20210705034232if_/https://www.reddit.com/r/Superstonk/comments/odsedt/is_the_bubble_bursting_its_all_connected_gme_will/) |
|
||||
|
||||
---
|
||||
|
||||
[DD 👨🔬](https://web.archive.org/web/20210705034232/https://www.reddit.com/r/Superstonk/search?q=flair_name%3A%22DD%20%F0%9F%91%A8%E2%80%8D%F0%9F%94%AC%22&restrict_sr=1)
|
||||
|
||||
I am an XXX holder and a QA rep. Numbers are my thing at work and analyzing the numbers on the market do not make sense right now. Please don't kick my ass over this not being charts of GME. I am thoroughly convinced that almost anything market related could lead to a GME squeeze.
|
||||
|
||||
By now, I'm sure everyone has read the house of cards, as well as, the everything short. GameStop is connected to everything as of this point. If we are talking about a 200,300,400 etc. % short interest, then everything leads back to GameStop. (or whatever entities are shorting GameStop) Downvote me if you'd like, but I believe the housing market could be our card to start our show if a dividend is not what first kicks us off.
|
||||
|
||||
*The Curtains are starting to be pulled open*
|
||||
|
||||
Why does this matter? Housing market doesn't affect GME?
|
||||
|
||||
FuCk YoU iT DoES. No but really, when these banks start losing money on defaults and risky mortgages, you really think they want to further their losses by dealing with some over leveraged funds? No. The house of cards is real, and it isn't if the house is coming down, its WHAT card will bring it down. Lets begin.
|
||||
|
||||
TLDR: Everyone is kicking the can down the road, even the government. I firmly believe we will see an economic collapse or correction of at least 35%. With GMEs negative beta and amount of short positions and naked shorting, should the housing market fall, it will create a ripple effect and the curtains for our show will be opened and it will begin. Inflation, unemployment, housing prices, CPI all rising but wages staying the same. The bubble is running out of room to expand.
|
||||
|
||||
[](https://web.archive.org/web/20210705034232/https://preview.redd.it/eo5b5hxb29971.png?width=971&format=png&auto=webp&s=c85f49314cf5d1c902e0371fdced51f83e44e50c)
|
||||
|
||||
Lumber prices currently cut in half from peak.
|
||||
|
||||
People who say lumber prices are fueling the housing inflation crisis are wrong, but, people will still look at this as a negative sentiment and may begin looking for an out. (selling their property)
|
||||
|
||||
[](https://web.archive.org/web/20210705034232/https://preview.redd.it/vglf4o3a39971.png?width=926&format=png&auto=webp&s=410fd94e4d65d16dff7d9b13dcc251a7745a8365)
|
||||
|
||||
Mortgage applications rate YOY Refinancing
|
||||
|
||||
[](https://web.archive.org/web/20210705034232/https://preview.redd.it/dxbdc15m39971.png?width=920&format=png&auto=webp&s=bb04c2a7cb3286f5cbe9c96c5bf81694de110bff)
|
||||
|
||||
Mortgage applications rate YOY new purchase
|
||||
|
||||
What this means simply is everyone who can qualify/afford a home at this point is almost exhausted and new applicants are simply either not able to qualify or can't find a home with this inflated market. Eventually there will not be enough demand to satisfy once forbearance ends and supply hits the market.
|
||||
|
||||
Here we take a look at housing prices related to income YOY. This is wrong. We have wages either staying stagnant or dropping and everything else increasing? No get fucked.
|
||||
|
||||
[](https://web.archive.org/web/20210705034232/https://preview.redd.it/4knhc92059971.png?width=916&format=png&auto=webp&s=c830f12787a33f9f729bf6e6198e05342ecf1abd)
|
||||
|
||||
Average Home Price YOY
|
||||
|
||||
[](https://web.archive.org/web/20210705034232/https://preview.redd.it/hjbhosr159971.png?width=855&format=png&auto=webp&s=8e869b0b98f985e63ea02aa4918b252c1c01ff65)
|
||||
|
||||
Wage Growth Tracker
|
||||
|
||||
The media is filling our heads with lies of a housing shortage but that is quite the contrary. People who SHOULD have been foreclosed on or otherwise not able to meet requirements, were not due to the forbearance, thus supply has not gone up. *(Don't get me wrong, we needed this badly with how things went last year, but they should have ended sooner than all of this. If you are someone who needs it and uses it responsibly, you have my blessing)*. I know a lot of people who misused this setting and instead of saving that money they weren't spending, they bought new shit like guns and cars etc. The truth is, supply of houses are about to be high.
|
||||
|
||||
[](https://web.archive.org/web/20210705034232/https://preview.redd.it/r7k9x7h869971.png?width=1258&format=png&auto=webp&s=cde9fc443d6734417050ffc709d29d061c95c237)
|
||||
|
||||
New housing starts
|
||||
|
||||
Here you can see that in fact housing development is at highest rates, or equal to in years. So what happens when all this new housing hits the market, forbearance ends and foreclosures begin? Well a lot of people lose their ass. Primarily the people who bought the top and now owe 400k on a home that's worth 360k. Again, this becomes the banks responsibility should the buyer not be able to weather the storm.
|
||||
|
||||
[](https://web.archive.org/web/20210705034232/https://preview.redd.it/sxyy8x3l79971.png?width=1454&format=png&auto=webp&s=da2e6c2312a86ccd2f76fcc822c08604bf351ceb)
|
||||
|
||||
CPI Chart
|
||||
|
||||
Again we have a CPI Chart that only rises, which wouldn't be a problem, but oh wait, wages are stagnant or decreasing.
|
||||
|
||||
Here is one last visual before I go to dinner with my family and watch fireworks.
|
||||
|
||||
[](https://web.archive.org/web/20210705034232/https://preview.redd.it/l9s45qsr89971.png?width=1133&format=png&auto=webp&s=40c882918f915d32c0af437f13001dd281abe9a5)
|
||||
|
||||
Delinquencies 30, 60, 90 days late all subject to foreclosure if the buyer cannot keep up.
|
||||
358
DD/2021-07-05-The-OTC-Conspiracy-Part-I.md
Normal file
358
DD/2021-07-05-The-OTC-Conspiracy-Part-I.md
Normal file
@ -0,0 +1,358 @@
|
||||
The OTC Conspiracy - GME, idiosyncrasies, and the infinite Banana Trees (Part 1)
|
||||
================================================================================
|
||||
|
||||
| Author | Source |
|
||||
| :-------------: |:-------------:|
|
||||
| [u/nayboyer2](https://www.reddit.com/user/nayboyer2/) | [Reddit](https://www.reddit.com/r/Superstonk/comments/oejtty/the_otc_conspiracy_gme_idiosyncrasies_and_the/) |
|
||||
|
||||
---
|
||||
|
||||
[DD 👨🔬](https://www.reddit.com/r/Superstonk/search?q=flair_name%3A%22DD%20%F0%9F%91%A8%E2%80%8D%F0%9F%94%AC%22&restrict_sr=1)
|
||||
|
||||
"Let's take another dive into that Dark Pool data
|
||||
|
||||
And learn why our stonk has such a Negative Beta
|
||||
|
||||
High Frequency Trading, when they got stuck
|
||||
|
||||
TLDR: Hedgies R Fuk"
|
||||
|
||||
I'm a long-winded SOB, so I'm going to break this into 2 parts.
|
||||
|
||||
I'll start with Part 1 and cover November through March.
|
||||
|
||||
I know Part 1 is a big stinky Data Dump, but I'll try to include some additional take-home points in Part 2 once they release the final May data.
|
||||
|
||||
Part 2 will include April through May plus some "Bananas for Thought".
|
||||
|
||||
There's a Visual TLDR at the end, so you could probably start there if you're not a data donkey like me.
|
||||
|
||||
I've been looking at the OTC data for a couple of months:
|
||||
|
||||
[Missing Bananas 1](https://www.reddit.com/r/Superstonk/comments/mvfs0c/over_30_of_gme_bananas_are_missing_from_bloomberg/) (4/21)
|
||||
|
||||
[Missing Bananas 2](https://www.reddit.com/r/Superstonk/comments/mx4j9p/dark_pool_dd_summary_and_a_quick_update_on_all/) (4/23)
|
||||
|
||||
[The OTC Conspiracy](https://www.reddit.com/r/Superstonk/comments/myf505/probably_the_last_dd_youll_ever_need_to_read_the/) (4/25)
|
||||
|
||||
[The OTC Conspiracy Part 2](https://www.reddit.com/r/Superstonk/comments/n5q76p/the_otc_conspiracy_part_2_shining_some_light_into/) (5/5)
|
||||
|
||||
[OTC Conspiracy Graph](https://www.reddit.com/r/Superstonk/comments/o5amd8/the_otc_conspiracy_this_graph_and_data_shows_gme/) (6/21)
|
||||
|
||||
There's no doubt in my mind that the OTC has been used for fuckery and manipulation in an effort to control the price. For this post, I decided to evaluate the OTC from a slightly more macro perspective. In the [OTC Conspiracy Part 2](https://www.reddit.com/r/Superstonk/comments/n5q76p/the_otc_conspiracy_part_2_shining_some_light_into/), I compared GME OTC to 33 other stocks. The sample wasn't perfect, but it was clear GME has been traded more in the OTC than any other stock.
|
||||
|
||||
For this post, I wanted to look at how GME has been handled in OTC compared to the OTC as a whole.
|
||||
|
||||
Why should we care about the OTC?
|
||||
|
||||
The NYSE President, Stacey Cunningham, confirmed in an interview last month that the prices of "meme stocks" may be distorted because the majority of trades in those names are executed away from public exchanges where share price formation occurs.
|
||||
|
||||
From the Reuters article about that interview, [Meme Stock Prices May Not Properly Reflect Demand](https://www.reuters.com/business/meme-stock-prices-may-not-properly-reflect-demand-nyse-president-2021-06-16/), Stacey Cunningham says:
|
||||
|
||||
"In some of the meme stocks that we've seen, or stocks that have a high level of retail participation, the vast majority of order flow can trade off of exchanges, which is problematic."
|
||||
|
||||
"That price formation is not really reflective of what supply and demand is."
|
||||
|
||||
"Individual traders contribute as much as 70% of the volume (in these stocks)"
|
||||
|
||||
As the article states, the majority of retail orders bypass exchanges because of Payment for Order Flow arrangements, in which retail brokerages sell their customers' marketable orders to wholesale brokers. The wholesalers match the orders internally, trying to profit off of the bid-ask spread, while offering retail traders the 'best market price or better'.
|
||||
|
||||
But the practice raises conflict of interest questions, including whether off-exchange trading - which is about 50% of the market when institutional block trades are included - distorts the price discovery mechanism for stocks, Gary Gensler said.
|
||||
|
||||
GGee... I wonder...
|
||||
|
||||
Preface to the Data
|
||||
|
||||
Let's jump right in. Please note that I removed De Minimis Firms from my monthly data analysis because these firms are too small or too cowardly to identify themselves as GME OTC participants (was dat u Melvin?). Each participant is identified individually in FINRA Total OTC data so it was very difficult to compare.
|
||||
|
||||
Because I had to remove De Minimis Firms from the analysis, the actual monthly GME OTC totals are slightly less than the original FINRA data that I presented in my previous posts. However, doing this allowed me to look at each participant's monthly activity across the entire OTC and compare it to their monthly activity for GME.
|
||||
|
||||
I have zero finance background, so I'm going to try to limit speculation as much as possible and leave that to the wrinkly-brained apes in the comments and in future posts.
|
||||
|
||||
All the data is directly from the [FINRA OTC website](https://otctransparency.finra.org/otctransparency/OtcIssueData).(<https://otctransparency.finra.org/otctransparency/OtcIssueData>)
|
||||
|
||||
FINRA somehow thinks it's fair and reasonable to release this "top secret data" at least 4 weeks delayed, so Part 2 will only include data through May, after it gets released tomorrow.
|
||||
|
||||
December and November OTC
|
||||
|
||||
A normal November and a December dial-up
|
||||
|
||||
[](https://preview.redd.it/gvkmrk5smh971.png?width=1580&format=png&auto=webp&s=ce9c3b62c8794e8a2cb2ef5301b070cba1fcb46d)
|
||||
|
||||
In November and December, GME OTC trades accounted for 0.11% and 0.17% of participants total OTC trading activity
|
||||
|
||||
November:
|
||||
|
||||
- 8 participants
|
||||
|
||||
- GME was 0.10% of Total OTC shares traded for these participants
|
||||
|
||||
- GME was 0.11% of Total OTC trades for these participants
|
||||
|
||||
- 201 million OTC trades; GME ~ 224,000
|
||||
|
||||
- OTC ~ 313 shares/trade; GME 290 shares/trade
|
||||
|
||||
- GME price ~ $12-16
|
||||
|
||||
December:
|
||||
|
||||
- 7 participants
|
||||
|
||||
- GME 0.13% of Total Shares
|
||||
|
||||
- GME 0.17% of Total Trades
|
||||
|
||||
- 241 million OTC trades; GME ~ 406,000 (81.3% monthly increase from November)
|
||||
|
||||
- OTC ~ 313 shares/trade; GME 247 shares/trade
|
||||
|
||||
- GME Price ~ $16-$20
|
||||
|
||||
In November, GME was 0.10% of total OTC shares traded and 0.11% of total OTC trades. To me, it makes sense to have a similar allocation of % shares traded and % trades. It also makes sense that the shares/trade for GME would be similar to the entire OTC marketplace (290 vs 313). That's why I feel like November provides a good basis for comparison even though GME was heavily manipulated well before November and December 2020.
|
||||
|
||||
In December, we already see these numbers begin to skew. GME was 0.13% of shares, and 0.17% of trades and the average shares/trade for GME dropped from 290 in November to 247 in December. The average shares/trade for these participants across the entire OTC marketplace (including GME) remained at 313.
|
||||
|
||||
January OTC
|
||||
|
||||
The January Jump-Off
|
||||
|
||||
[](https://preview.redd.it/b9v5q2oqk9971.png?width=1770&format=png&auto=webp&s=15926b50d64846a4da254cc245025db4fd9e279c)
|
||||
|
||||
In January, GME OTC trades accounted for 1.85% of all OTC trades for these participants. GME shares accounted for 0.51% of all OTC shares traded
|
||||
|
||||
January:
|
||||
|
||||
- 14 participants (from 7 in December)
|
||||
|
||||
- GME was 0.51% of Total OTC shares traded
|
||||
|
||||
- The monthly % increase in GME OTC shares traded OTC was over 518% from December and over 700% from November
|
||||
|
||||
- GME was 1.85% of Total OTC Trades for these participants
|
||||
|
||||
- Up from 0.17% in December and 0.11% in November
|
||||
|
||||
- OTC ~ 311 million trades; GME 5.76 million trades
|
||||
|
||||
- 1319% monthly % increase in GME OTC trades from December
|
||||
|
||||
- 2473% monthly % increase in GME OTC trades from November
|
||||
|
||||
- OTC ~ 328 shares/trade; GME 90 shares/trade
|
||||
|
||||
- GME closing price ~ $17 - $347 (but only 4 trading days closed above $100)
|
||||
|
||||
We know that the volume in January was literally bananas (over 1.26 billion). And over 49% of that volume (over 624 million) went to the OTC and ATS dark pools.
|
||||
|
||||
The GME average shares/trade decreased from 247 to 90, while the average shares/trade for these participants across the entire OTC marketplace (including GME) increased from 313 to 328.
|
||||
|
||||
GME was 0.51% of total OTC shares traded for these participants.
|
||||
|
||||
Meanwhile, the idiosyncrasy of % shares and % trades was further amplified, with GME accounting for 1.85% of total OTC trades. So almost 1 out of every 50 OTC trades across the entire OTC marketplace for these participants was GME.
|
||||
|
||||
Meanwhile, more than 1 out of every 50 OTC trades (2.23%) that Citadel made in January was GME (and they trade a LOT of securities). They traded more shares OTC in January than any other month to date. Their shares/trade for GME dropped from 360 to 98, while their shares/trade for the entire OTC (including GME) increased from 353 to 390. They increased their GME monthly shares from 47 million in December to over 252 million (an increase of 432%). They made almost 2.56 million GME OTC trades, an increase of over 1840% from December and an increase of over 3270% from November.
|
||||
|
||||
They weren't acting alone. I bolded all of the participants whose GME trades accounted for >1% of their overall OTC trades (11 of 14 participants).
|
||||
|
||||
- Virtu increased their GME trades by over 1150%
|
||||
|
||||
- G1 Execution increased their GME OTC trades by over 1419%
|
||||
|
||||
- Jane Street increased their GME OTC trades by over 1842%
|
||||
|
||||
- and UBS Securities increased their GME OTC trades by over 1423%
|
||||
|
||||
- Two Sigma (436%) and Wolverine (441%) also increased their trading in January
|
||||
|
||||
Their only chance at remaining solvent was to turn off the buy button, kick the can with married puts, and initiate Fuckery in February.
|
||||
|
||||
February OTC
|
||||
|
||||
The February Fuckery was Afoot
|
||||
|
||||
[](https://preview.redd.it/szdozinfk9971.png?width=1773&format=png&auto=webp&s=408609baf93e5a3a253daf1b49bc21a6e28649c4)
|
||||
|
||||
Robinhood enters the fray in February, making 772,000 trades with 774,600 shares
|
||||
|
||||
February
|
||||
|
||||
- 14 participants (from 14 in January)
|
||||
|
||||
- GME accounted for 0.31% of Total OTC shares traded (from 0.51% in January)
|
||||
|
||||
- The monthly GME OTC shares decreased 42.3% from January
|
||||
|
||||
- However, the monthly GME OTC shares traded was still up over 199% from December and over 361% from November
|
||||
|
||||
- GME accounted for 2.24% of Total OTC Trades for these participants
|
||||
|
||||
- Up from 1.85% in January, 0.17% in December, and 0.11% in November
|
||||
|
||||
- OTC ~ 345 million trades; GME 7.73 million trades
|
||||
|
||||
- 34.2% monthly % increase in GME OTC trades from January
|
||||
|
||||
- 1804% monthly % increase in GME OTC trades from December
|
||||
|
||||
- 3353% monthly % increase in GME OTC trades from November
|
||||
|
||||
- OTC ~ 283.3 shares/trade; GME 38.8 shares/trade
|
||||
|
||||
- GME closing price ~ $40-$225 (but only 3 trading days closed above $100)
|
||||
|
||||
So, while there was a 42% decrease in GME shares traded OTC, there was a 34.2% increase in trades... What else changed?
|
||||
|
||||
Robinhood entered the OTC for the first time in February. They actually eased into it nice and slow.
|
||||
|
||||
- Week of 2/1 - 0 trades
|
||||
|
||||
- Week of 2/8 - 1,675 trades
|
||||
|
||||
- Week of 2/15 - 14,900 trades
|
||||
|
||||
Warming up with a little foreplay before the real GME molestation began.
|
||||
|
||||
During the week of 2/22 they made over 755,400 trades with over 757,900 of our shares. You don't need a math degree to see that averages out to almost exactly 1.00 shares/trade.
|
||||
|
||||
This was likely in an effort to try to mitigate the increase in price from having to cover some of January's mountain of FTDs that weren't tucked away in options. I remember watching these fuckers desperately try to suppress the price on 2/25 and 2/26.
|
||||
|
||||
- We opened on 2/24 at $44 and closed at $91 on 83 million in volume.
|
||||
|
||||
- We opened on 2/25 at $169, yet somehow closed at $108 on over 150 million in volume.
|
||||
|
||||
- On 2/26, we opened at $117 and closed at $101 on over 92 million in volume.
|
||||
|
||||
I thought this deserved a closer look.
|
||||
|
||||
[](https://preview.redd.it/ci4tbrc4a9971.png?width=1715&format=png&auto=webp&s=0b2049cab89ede5ab148f33a867774c890431c51)
|
||||
|
||||
February Fuckery was afoot during the week of 2/22. Robinhood made almost 24% of the GME OTC trades that week, more than even Citadel and trailing only Virtu
|
||||
|
||||
Robinhood accounted for almost 24% of GME's weekly OTC trades, trailing only Virtu. They made more GME OTC trades than Citadel. GME accounted for almost 17.5% of their total OTC shares and almost 18.7% of their total OTC trades.
|
||||
|
||||
GME was over 5.56% of the total OTC trades for these participants during the week of 2/22, but only 0.70% of the volume. GME was over 3% of total OTC trades in 13 out of the 15 participants (in bold).
|
||||
|
||||
There were over 3.157 million GME trades on the OTC during this one week!
|
||||
|
||||
To put that into perspective, the number of GME OTC trades in December was 406,000 and the number of GME OTC trades in November was less than 224,000. In fact, there was 225% more GME trades made in the OTC in that one week than September, October, November, and December COMBINED (1.4 million trades).
|
||||
|
||||
The average shares/trade across the entire OTC (including GME) for these participants was over 305. The average shares/trade for GME was 38.5.
|
||||
|
||||
I'm sure there are more connections we can make from this one week of data, but for brevity sake, I'm going to zoom back out to the monthly data.
|
||||
|
||||
In February, Citadel was able to decrease the number of GME shares traded OTC by over 54% from January. However, Citadel actually increased the number of GME trades made OTC by 3.73% from January (an increase of 1912% from December and 3396% from November). Their average GME shares/trade decreased from 98.6 in January to 43.6 in February. Their average shares/trade across the entire OTC (including GME) dropped from 390 to 330. GME was still over 2% of their total OTC trades, but only 0.27% of their total OTC shares. It certainly seems like Ken was playing high frequency patty cake with his good pal Vlad, now that RH had conveniently joined the OTC frenzy.
|
||||
|
||||
Citadel and Robinhood weren't the only participants to participate in this HFT frenzy. Virtu decreased their GME OTC shares traded by 15%, but increased the number of GME OTC trades by 12.25%. Their average shares/trade GME dropped from over 77 in January to 58 in February. GME accounted for 0.36% of their total OTC shares, but 1.94% of their total OTC trades.
|
||||
|
||||
Wolverine went from 98 GME shares/trade in January to 3.85 shares/trade in February. They did so by decreasing the shares traded by 91%, while increasing the number of trades by 127.6%. GME was 0.03% of their total OTC shares traded, but 2.23% of their total OTC trades. No wonder why they sold their GME.
|
||||
|
||||
G1 Execution dropped their GME shares/trade from 142 in January to 28.8 in February. They decreased their monthly GME shares traded by 64% and increased their monthly trades by almost 78% from January (up 2602% from December and 4033% from November). GME was over 3.8% of their total OTC trades, but only 0.45% of their OTC volume. Their shares/trade decreased from 142 in January to 28.8 in February (vs 244.7 for the entire OTC including GME).
|
||||
|
||||
Two Sigma increased their GME OTC trades by almost 83% from January (up 881% from December and 1541% from November), but increased their shares by only 17.8%. Their shares/trade for GME dropped to an all-time low of 17.75.
|
||||
|
||||
I could keep going with February Fuckery, but let's move on to The March Manipulation.
|
||||
|
||||
March OTC
|
||||
|
||||
The March Manipulation
|
||||
|
||||
[](https://preview.redd.it/ponb5hgvj9971.png?width=1621&format=png&auto=webp&s=8799c8667e212f9fc0a61ca930fa8c82228fc9ce)
|
||||
|
||||
Robinhood upped the ante with 1.656 million trades using 1.658 million shares. The total percent of OTC trades that was GME increased for the 5th straight month to 2.32%.
|
||||
|
||||
March:
|
||||
|
||||
- 12 participants (from 14 in February)
|
||||
|
||||
- GME accounted for 0.30% of Total OTC shares traded (from 0.31% in February)
|
||||
|
||||
- The monthly GME OTC shares decreased 17.07% from February
|
||||
|
||||
- However, the monthly GME OTC shares traded was still up almost 148% from December and almost 283% from November
|
||||
|
||||
- GME accounted for 2.32% of Total OTC Trades for these participants increasing for the 5th straight month
|
||||
|
||||
- Up from 2.24% in February, 1.85% in January, 0.17% in December, and 0.11% in November
|
||||
|
||||
- OTC ~ 329 million trades; GME 7.65 million trades
|
||||
|
||||
- 1.06% monthly % decrease in GME OTC trades from February
|
||||
|
||||
- 32.8% monthly % increase in GME OTC trades from January
|
||||
|
||||
- 1784% monthly % increase in GME OTC trades from December
|
||||
|
||||
- 3317% monthly % increase in GME OTC trades from November
|
||||
|
||||
- OTC ~ 255.3 shares/trade; GME 32.5 shares/trade
|
||||
|
||||
- GME closing price ~ $120-$265 (9 out of 20 trading days closed above $200)
|
||||
|
||||
The GME shares/trade dropped to an all-time low of 32.5. Robinhood increased their GME OTC shares traded and number of GME OTC trades by 114% each. March was the month of the great Robinhood exodus, and it's likely that they began scrambling for shares. GME was over 7% of their total OTC shares and over 7.3% of their total OTC trades.
|
||||
|
||||
The idiosyncrasies between % of total shares (0.30%) and % of total trades (2.32%) continued to widen. This is shown in the decreasing shares/trade and in the monthly % change (-17% shares vs -1% trades).
|
||||
|
||||
Citadel's shares/trade for the entire OTC was almost 317.8, while their shares/trade for GME was 42.6.
|
||||
|
||||
Jane Street continued to increase their GME OTC trading activity by another 60% in March (a 3705% increase from December and 6614% increase from November).
|
||||
|
||||
Virtu continued to decrease their shares traded, while increasing their GME trades. They were the most active GME OTC participant in March, making almost 2 million trades, while dropping their shares/trade from 58 to 48. Meanwhile, their shares/trade across the entire OTC (including GME) was 279.
|
||||
|
||||
The week of March 8th was kind of wacky:
|
||||
|
||||
[](https://preview.redd.it/z2yxmkqj8a971.png?width=1638&format=png&auto=webp&s=82e40b3b4208b6c5f88ddada08f96cd27d021d1f)
|
||||
|
||||
Robinhood leads the entire GME OTC in Trades
|
||||
|
||||
Robinhood was 1.00% of the weekly OTC shares, but used those 765,000 shares to make over 763,000 trades, which was 25.78% of the weekly total. They made more OTC trades than any other participant. GME was almost 20% of their total OTC shares and almost 21% of their total OTC trades.
|
||||
|
||||
Think about how many GME shares Robinhood had on default Margin in January... The mass exodus foiled their plan.
|
||||
|
||||
There were 2.96 million GME OTC trades in one week. That's 211% more trades in one week than September, October, November, and December COMBINED (1.4 million trades).
|
||||
|
||||
Shares/trade for the entire OTC (including GME) was 319.46, while shares/trade for GME was 25.85.
|
||||
|
||||
GME accounted for 0.50% of the total OTC shares, but 6.15% of the total OTC trades. GME accounted for more than 3% of their total OTC trades for 13 out of 15 OTC participants. For G1 Execution, GME accounted 0.86% of their total OTC shares, but 9.20% of their total OTC trades.
|
||||
|
||||
GME was only 0.57% of Virtu's OTC shares, but almost 5% of their total OTC trades.
|
||||
|
||||
GME was only 0.36% of Citadel's OTC shares, but 4.16% of their total OTC trades.
|
||||
|
||||
For the Visual Apes
|
||||
|
||||
Let's end Part 1 with little TLDR:
|
||||
|
||||
Monthly GME OTC trades September - March
|
||||
|
||||
[](https://preview.redd.it/72uezos4dh971.png?width=699&format=png&auto=webp&s=8e742a99fde0798cfd6f2d0b435517d2dfddbdf6)
|
||||
|
||||
Huge increase in GME OTC trades
|
||||
|
||||
Weekly GME OTC Trades (late September - March)
|
||||
|
||||
[](https://preview.redd.it/g6b7rhlbhh971.png?width=1004&format=png&auto=webp&s=cd6de72fae89ad38c842e13a69ff3cb574f65621)
|
||||
|
||||
These weeks seem to stand out...
|
||||
|
||||
GME monthly Shares/Trade OTC from September - March
|
||||
|
||||
[](https://preview.redd.it/kuohghnugh971.png?width=745&format=png&auto=webp&s=0047c2b43cf6d878f2ab42a52367c81526125272)
|
||||
|
||||
Shrinking shares/trade
|
||||
|
||||
GME Shares/Trade OTC vs. Entire OTC Marketplace (including GME) - November - March
|
||||
|
||||
[](https://preview.redd.it/moaplsfrgh971.png?width=983&format=png&auto=webp&s=329a69fd0e09fc69f38a60578cf8ce3880660a04)
|
||||
|
||||
Shrinking shares/trade - Spoiler alert, it's only getting worse...
|
||||
|
||||
Lastly, using an estimated GME Float of 26.7 million (January - March before share offerings), and comparing it to a few other stocks (see [OTC Conspiracy Part 2](https://www.reddit.com/r/Superstonk/comments/n5q76p/the_otc_conspiracy_part_2_shining_some_light_into/) for more info and examples):
|
||||
|
||||
[](https://preview.redd.it/ifaffppgjh971.png?width=1198&format=png&auto=webp&s=2dafcba6ae97dffa86c4ad806dac09bcafcdcf6a)
|
||||
|
||||
Over 4000% GME Float traded OTC in Q1
|
||||
|
||||
Part 2 coming soon!
|
||||
|
||||
Buy, HODL, and Buckle Up! Power to the Players
|
||||
236
DD/2021-07-06-Citadel-China-and-The-45th-Investigation.md
Normal file
236
DD/2021-07-06-Citadel-China-and-The-45th-Investigation.md
Normal file
@ -0,0 +1,236 @@
|
||||
Citadel, China and The 45th - A Triangular Investigation Into "He's trying to hide some of his money"
|
||||
=====================================================================================================
|
||||
|
||||
| Author | Source |
|
||||
| :-------------: |:-------------:|
|
||||
| [u/incandescent-leaf](https://www.reddit.com/user/incandescent-leaf/) | [Reddit](https://www.reddit.com/r/DDintoGME/comments/oeptry/citadel_china_and_the_45th_a_triangular/) |
|
||||
|
||||
---
|
||||
|
||||
[𝘜𝘯𝘷𝘦𝘳𝘪𝘧𝘪𝘦𝘥 𝘋𝘋](https://www.reddit.com/r/DDintoGME/search?q=flair_name%3A%22%F0%9D%98%9C%F0%9D%98%AF%F0%9D%98%B7%F0%9D%98%A6%F0%9D%98%B3%F0%9D%98%AA%F0%9D%98%A7%F0%9D%98%AA%F0%9D%98%A6%F0%9D%98%A5%20%F0%9D%98%8B%F0%9D%98%8B%22&restrict_sr=1)
|
||||
|
||||
Ken Griffin - Citadel. What a guy he is. Where are you, Ken? Where the hell is he? He's trying to hide some of his money.
|
||||
|
||||
- Trump, January 15th 2020
|
||||
|
||||
TL;DR
|
||||
|
||||
- Ken Griffin already has hidden his money, we know he has offshore accounts. Why would he be speaking with Trump about hiding assets?
|
||||
|
||||
- The direct context of the quote is all good news for Citadel's operations in China, so why was Ken absent from the ceremony and why did Trump not praise him (but praised everyone else)?
|
||||
|
||||
- I spectulate Trump was actually talking about Griffin wanting to hide his *trades*
|
||||
|
||||
- Circumstantial evidence for this is that 1 day before this quote, sweeping changes to the National Market System finally hit the Federal register. These changes as I have [somewhat poorly] analyzed before will make market-making and PFOF a lot less profitable for Citadel (and Virtu and other market makers), and also tidy up some loopholes likely being abused by Citadel.
|
||||
|
||||
Preface
|
||||
|
||||
This DD is about what many apes thought was a throwaway line, and so did I until recently. But I have been thinking about it lately, and the more I investigated the context, the more I came to suspect it was actually a rare, blurry glimpse into the underbelly of interactions between Wall street and US politics.
|
||||
|
||||
I was actually writing another DD before I came to write this, but it started to become too large of a topic, so I thought I better break off this 'sub-investigation' into its own contained unit, as it's neatly separable, and was only ever circumstantial evidence anyway.
|
||||
|
||||
I have deliberarely kept this post non-political, and expect all comments to be non-political as well. It's a superstonk rule that all posts/comments be non-political (Rule 5 -Improper Content). Here is a diagram of what we will be covering:
|
||||
|
||||
[](https://preview.redd.it/b7647vvlkj971.png?width=750&format=png&auto=webp&s=3dbbdc97ff90810db1557f6429ac134d7fd7cff5)
|
||||
|
||||
January 15th 2020 - Signing of Phase One of U.S. - China Trade Deal
|
||||
|
||||
January 15th, a Thursday marked a historic signing of Phase One of a U.S. - China trade deal. President Trump had made U.S. - China relations a central component of his policy as President for years before this, and so this agreement was a culmination of many years of work. Contrary to what was shown in the media, the agreement was not just about manufacturing, agriculture and intellectual property. The trade agreement has a whole chapter devoted to Financial Services - mostly with China agreeing to allow the US access to their markets. Some sources even claimed that financial services was the winner of the entire trade agreement.
|
||||
|
||||
On Monday the 20th January, only 5 days after this trade agreement was signed - Citadel Securities had agreed to pay a $97 Million Settlement to Chinese financial regulators, bringing a close to 5 years of active investigations and being partially banned from trading in China. We will return to this event later on in the DD. For now, let's dive into the signing ceremony of the trade agreement.
|
||||
|
||||
[Trump spoke for about an hour at the signing.](https://www.c-span.org/video/?468176-1/us-china-trade-deal) The first 27 minutes were overall remarks about the trade situation, and a lot of thanking personal friends and other political allies (I have pulled out relevent people's quotes):
|
||||
|
||||
> TRUMP: [Hank Greenberg](https://en.wikipedia.org/wiki/Maurice_R._Greenberg) is here. Hank. If they took care of Hank, they wouldn't have had the problems that they had. Where's Hank? Hank Greenberg. (Applause.) Oh, Hank. If Hank stayed there like he should have, you wouldn't have had the problem that you ended up having with our economy. But it's great to have you, Hank. Thank you very much.
|
||||
|
||||
After this time, Trump begins to speak to industry professionals and other government appointees. This carries on for 10 minutes, and plenty of financial industry professionals were greeted by name (the roll-call was in alphabetic order). I have pulled out all the ones I can recognize:
|
||||
|
||||
> TRUMP: Ajay Banga, of Mastercard. Thank, Ajay. Fantastic job.
|
||||
|
||||
> TRUMP: Brian Duperreault, of AIG. Do you know that company, Hank? AIG. Did you ever hear of AIG, Hank Greenberg? Thank you very much. I appreciate it, Brian.
|
||||
|
||||
This is a joke. :) Hank Greenberg was the head of AIG.
|
||||
|
||||
> Mary Erdoes, JPMorgan Chase. They just announced earnings, and they were incredible. Where - where are you? They were very substantial. Will you say, "Thank you, Mr. President" at least? Huh? (Laughter.) I made a lot of bankers look very good. But you're doing a great job. Say hello to Jamie [Dimon]. I think we're seeing him tomorrow.
|
||||
|
||||
Then it was Ken's turn:
|
||||
|
||||
> TRUMP: Ken Griffin, Citadel. What a guy he is. Where are you, Ken? Where the hell is he? He's trying to hide some of his money. Look, he doesn't want to stand up. Where the hell is Ken? See, Steve, you'll stand, and he's very quiet about it. He's in here someplace; he just doesn't want to stand.
|
||||
|
||||
Notice how Trump doesn't praise Ken? I'm also not sure who Steve is in this context.
|
||||
|
||||
> TRUMP: Al Kelly, Visa. Al Kelly. Al Kelly, thank you.
|
||||
|
||||
> TRUMP: Alan MacDonald, Citibank. Citibank. (Applause.) Good. Boy, you brought that back so far. I remember seven, eight years ago. But Citibank is doing fantastically well.
|
||||
|
||||
> TRUMP: Raymond McDaniel, Moody's. Good. Are you giving us good ratings, Raymond, please? Okay? We're doing pretty good, right?
|
||||
|
||||
> TRUMP: Paul Taylor, of Fitch. That's another good ratings group. Are we doing okay at Fitch? Good. Otherwise, I wouldn't have introduced you, if I thought - (laughter).
|
||||
|
||||
> TRUMP: Kevin Warsh. Kevin. Where's Kevin? I don't know, Kevin. I could have used you a little bit here. Why weren't you more forceful when you wanted that job? Why weren't you more forceful, Kevin? You're a forceful person. In fact, I thought you were too forceful, maybe, for the job. And I would have been very happy with you.
|
||||
>
|
||||
> But, Kevin, thank you for being here. You understand that very well, right? It bothers me when Germany and other countries are getting paid to borrow money. This is one - I don't know where that all leads, but we have to pay. We're the number one in the world, by far, and we have to pay for our money. Our interest rates are set high by the Fed. Our dollar is very high, and - relatively speaking. But when other countries get - literally, they're under. They have negative rates - meaning, they're under. They get paid. I love this. This concept is incredible. Again, you don't know where the hell it leads. But you borrow money, and when you have to pay it back, they pay you. This is one that I like very much. And I'm going to talk to you about that, Lou Dobbs.
|
||||
>
|
||||
> So we're set at two. Tell me, why are we paying and other countries are getting money when they get paid back? I really want to know: Who are the people that buy this stuff? Who puts money into something when they say, "This is a guaranteed loss"? But that's a whole different group of people than I know.
|
||||
|
||||
Quite a story there for Kevin Warsh! [[During and in the aftermath of the 2008 financial crisis, Warsh was a governor of the Federal Reserve System, and acted as the central bank's primary liaison to Wall Street](https://en.wikipedia.org/wiki/Kevin_Warsh)]
|
||||
|
||||
> TRUMP: Glenn Youngkin, of Carlyle. [Carlyle Group](https://en.wikipedia.org/wiki/The_Carlyle_Group). Great group.
|
||||
|
||||
Also present at the signing was Kenneth Berntsen - the chairman of the [Engage China Coalition](http://engagechina.com/2020/02/engage-china-coalition-regarding-china-phase-one-trade-agreement-and-financial-services/). That's a group of financial industry heavyweights who've been trying for years to pry open the door to the Chinese market. Up until now, they haven't had much luck. Even though China's the world's second-largest economy, Bentsen says U.S. financial firms make only about $2 billion a year there, less than a third what they make in Brazil and about 1.5% of what they make in Europe.
|
||||
|
||||
The Engage China Coalition:
|
||||
|
||||
American Bankers Association
|
||||
|
||||
American Council of Life Insurers
|
||||
|
||||
American Property Casualty Insurance Association
|
||||
|
||||
BAFT (Bankers Association for Finance and Trade)
|
||||
|
||||
The Council of Insurance Agents and Brokers
|
||||
|
||||
The Financial Services Forum
|
||||
|
||||
The Futures Industry Association
|
||||
|
||||
Insured Retirement Institute
|
||||
|
||||
Investment Company Institute
|
||||
|
||||
Securities Industry and Financial Markets Association
|
||||
|
||||
The Trade Agreement Itself - Chapter 4 Financial Services
|
||||
|
||||
[Some analysts have said that financial services was the clear winner of the trade agreement](https://www.npr.org/2020/01/16/797098404/u-s-financial-services-industry-emerges-as-%20%20a-winner-of-u-s-china-trade-deal). And I can see why given the changes actually demanded. [Here is the full text](https://ustr.gov/sites/default/files/files/agreements/phase%20one%20%20%20agreement/Economic_And_Trade_Agreement_Between_The_United_States_And_China_Text.pdf) of chapter 4 itself
|
||||
|
||||
[](https://preview.redd.it/956oetrnkj971.png?width=715&format=png&auto=webp&s=bf3cd92124b48eb70310fdfa58dfb08b88d34612)
|
||||
|
||||
[](https://preview.redd.it/n1mef1gokj971.png?width=748&format=png&auto=webp&s=3caca5e4df26ca4370b36cdc6bebc38ac62f3b9c)
|
||||
|
||||
[](https://preview.redd.it/ee7pqj4pkj971.png?width=743&format=png&auto=webp&s=aaa276e1b863139834548e2348d76f25e99d5ce1)
|
||||
|
||||
[](https://preview.redd.it/sd15xbvpkj971.png?width=738&format=png&auto=webp&s=8b4fc9dfe0d9587b64c376d5c9bfae5c01b813fa)
|
||||
|
||||
The agreement itself allows major US expansion into the Chinese markets, and overall - it seems like a clear win for the US.
|
||||
|
||||
Trade Agreement Summary
|
||||
|
||||
So looking back at all the finance professionals Trump spoke to, did you notice anything strange? Ken was the only finance-related attendee Trump didn't praise. In fact it looks like out of everyone spoken about, Ken was the only one not being praised. This is unusual for Trump, because he usually praises everyone, a lot. Unless he does not like someone.
|
||||
|
||||
So why did Ken Griffin not turn up, when all the other financial industry professionals did? Did he know that Trump was going to say something provocative, or was it something else?
|
||||
|
||||
If the Engage China Coalition and other finance folks were so pleased with the trade agreement, how could Ken Griffin be upset about it? This trade agreement is supposed to be good for the US financial industry access to Chinese markets...
|
||||
|
||||
And why did Citadel Securities pay their $97 Million fine only 3 business days later after this trade agreement? They've been locked out of China for almost 5 years - surely they would've done it sooner if they could? Or if the trade agreement was necessary for Citadel to regain access, why didn't Ken turn up to say thanks?
|
||||
|
||||
However before we dig deeper into this trade agreement, Citadel's fine and the Trump / Griffin relationship we need to go all the way back to the beginning of this story.
|
||||
|
||||
Citadel Securities in China
|
||||
|
||||
Under previous Chinese laws - foreign companies had to partner with local companies to operate in China. Citadel Securities opened Citadel Shanghai Trading Ltd in 2010, and parterned with Guosen Securities who managed their trading account.
|
||||
|
||||
[In June 2015, the Chinese stock markets were devastated with a large crash](https://en.wikipedia.org/wiki/2015%E2%80%932016_Chinese_stock_market_turbulence), wiping nearly $5 Trillion of value out at the bottom. By July, the Shanghai stock market was down 30%, and more than half of listed companies had filed for trading halts in an attempt to prevent further losses. By August 2015, stock prices had dropped a total of 43 percent.
|
||||
|
||||
Chinese regulators began to crack down on abusive market practices, and Citadel was the first to be caught. Starting at the beginning 2015, Citadel is accused of using deceptive and illegal trading practices in order to manipulate stock prices. Citadel was accused variously of "co-ordinated stock dumping", "selling-off of heavily weighted stocks", automated, algorithm-driven trading, spoofing, and of course - "malicious short-selling". Their account held by Guosen was banned.
|
||||
|
||||
["The regulator alleged that Citadel Securities controlled and used accounts set up by four other firms to trade stocks during the first seven months of 2015 and said such behaviors were suspected of violating account and asset management rules without providing further details."](https://www.wsj.com/articles/after-a-four-year-freeze-citadel-securities-can-trade-again-in-china-11579526314)
|
||||
|
||||
["Chinese regulator, however, didn't ban the practice [short selling] entirely, but after the scrutiny, investors can't sell and then buy shares back the same day. Instead, they must now wait after completion of a short sale transaction until at least the next day to repurchase."](https://www.financemagnates.com/institutional-forex/regulation/citadel-securities-fined-97m-in-china-for-malicious-short-selling/)
|
||||
|
||||
This restriction (if true, I can't read Chinese) implies that shares were being traded back and forth between the same parties multiple times a day. This is textbook [wash trading](https://www.investopedia.com/terms/w/washtrading.asp), which rose to prominence in 2013 in Western markets.
|
||||
|
||||
["The tiff doesn't end there for Citadel. George Chen, managing editor of the international edition for the South China Morning Post, tweeted that a government-backed publication called ThePaper.cn was implying that Citadel advisor and former Federal Reserve Chairman Ben Bernanke somehow knew that the high-frequency trading firm was shorting the market."](https://www.nexchangenow.com/news/11995/in-hunt-for-short-sellers-china-suspends-citadel-unit-from-trading-and-hints-advisor-bernanke-may-know-about-shorts/)
|
||||
|
||||
Goldman Sachs was also caught in this crackdown, and they were also banned from trading. Local Chinese firms were also caught as well, but generally emerged largely with miniscule fines and slaps on the wrist.
|
||||
|
||||
April 24th, 2019 it was announced Goldman Sachs had been cleared by the China Securities Regulatory Commission [CSRC], with a fine of $22.93 Million. In late 2019 the CSRC began to reconcile with Citadel, and only on January 20th 2020 (after the signing of the Trade agreement) - was it announced Citadel had settled for $97 Million. According to a somewhat opaque statement released by the CSRC on January 20, the settlement for Citadel Securities was "based on differing circumstances, such as the amount of money made through the suspected illegal acts,"
|
||||
|
||||
In summary for this section, Citadel was caught in China performing many of their tricks, and based on the timing - it seems likely they were unbanned only with US government intervention in late 2019 / early 2020, around the time of the U.S. - China Trade Agreement Phase One. So if Citadel was unbanned from their planned expansion in China, why did Ken snub Trump, and why did Trump not praise Ken? It's time to take a look at the Ken Griffin & Trump relationship.
|
||||
|
||||
Ken Griffin & Trump's Relationship
|
||||
|
||||
It's difficult to find much on their relationship, and I've pieced together what I can from a few events.
|
||||
|
||||
[Ken Griffin donated $1.55M in 2012 to Romney's campaign.](https://www.cnbc.com/2016/09/23/megadonors-like-ken-griffin-peter-thiel-keep-their-wallets-closed-for-trump.html)
|
||||
|
||||
[In 2016 - he donated $2.6M to Rubio, rather than Trump.](https://www.rollingstone.com/politics/politics-news/meet-the-gop-mega-donors-of-the-2016-election-223992/)
|
||||
|
||||
[Griffin did give $100,000 to Trump's 2017 inauguration though - a relatively low amount.](https://news.artnet.com/art-world/steve-cohen-1m-trump-donation-930890)
|
||||
|
||||
[Ken Griffin was hosted at a private donor's dinner later (probably in 2017) by Pence](https://thehill.com/homenews/administration/341196-pence-holding-private-donor-dinners-at-vice-presidents-residence)
|
||||
|
||||
In 2018, Ken Griffin began to speak out against Trump's policies, notably criticizing Trump's criticism of J-Pow & Fed policies , and also criticizing the tariff war escalation with China.
|
||||
|
||||
[In this interview on Delivering Alpha](https://www.youtube.com/watch?v=KIIFm2kmif0), Ken is asked what are his thoughts on the Administration's trade policies with China. Ken pauses briefly, shifts his gaze downwards, and then using a hand gesture, a gulp, begins to try and explain using his nicest words, how Trump is doing a great job with the trade war "Trump unquestionably has the right mission on trade", but that Ken doesn't really understand how the negotiations are going, and suspects they are very complicated. He makes a comment about how he would never have so many active 'fronts' open, and would close some of them. When asked directly, he refuses to comment on whether he thinks Trump is doing a good job. It seems relatively clear to me that he's having difficulty delivering his words with convicition. Then for his final words Ken regains his speaking conviction, and clearly tears down the idea that tariffs are good.
|
||||
|
||||
In 2016, Ken Griffin made a total political donations of only $11.2 Million (to Republican-allied super PACs). In 2018, it was $19.2 Million.
|
||||
|
||||
In 2020, Ken Griffin donated a whopping $66 Million to Republican-allied super PACs! [In fact, Ken Griffin came in at number 4 on the individual donors list for the 2020 election cycle.](https://www.opensecrets.org/outsidespending/summ.php?cycle=2020&disp=D&type=V&superonly=N)
|
||||
|
||||
Also in March 2020, Ken Griffin advised President Trump on how to open up the economy after Covid, along with other finance professionals (e.g. Steve Cohen).
|
||||
|
||||
In summary for this section, I don't think Trump & Griffin saw eye to eye on many issues, or even had a friendly relationship. However it's very clear, especially towards the end of 2020, they had a working relationship, and that Ken Griffin bet very heavily on a 2nd Trump term - which we can assume would be greatly beneficial for Citadel.
|
||||
|
||||
I didn't get time to look into Jay Clayton (Trump's SEC chairman appointee), and who Clayton's changes at the SEC benefitted - but suspect this would be a fruitful thing to investigate.
|
||||
|
||||
Bringing It All Together
|
||||
|
||||
So I hope I have covered somewhat the Citadel, China & Trump triangle. In the first section, we saw that it was unusual how Trump addressed Griffin versus other attendees, and that Griffin had a lot to gain from this trade deal.
|
||||
|
||||
In the second section, we learned about Citadel's ban from trading in China, and how their unbanning seemed to also follow the trade deal - even more reason for Griffin to be pleased, and more curious that he didn't appear.
|
||||
|
||||
In the third section, we learned a bit about Ken Griffin's and Trump's relationship, and how even though they were not close friends, they had developed a significant working relationship and Griffin *heavily* bet on Trump winning the 2020 election.
|
||||
|
||||
In short - what I have uncovered is mostly that Ken Griffin had a lot to gain from Trump's China trade deal, and I can't make any sense of why he snubbed the signing ceremony, or wasn't praised by Trump. That's it - that's my point.
|
||||
|
||||
Speculation Section
|
||||
|
||||
So what else could make sense then? Well what if when Trump mentioned that Ken wants to hide his money, he wasn't talking about money. Ken wanted to hide his trades.
|
||||
|
||||
Well looky here what dropped onto the Federal register on the Monday before the signing ceremony. Sweeping changes to the National Market System (Reg NMS II) that make market-making less profitable for entities such as Citadel and Virtu, and also make PFOF more difficult.
|
||||
|
||||
<https://www.federalregister.gov/documents/2020/01/14/2020-00358/joint-industry-plan-notice-of-filing-of-the-forty-seventh-amendment-to-the-joint-self-regulatory>
|
||||
|
||||
<https://www.federalregister.gov/documents/2020/01/14/2020-00359/consolidated-tape-association-notice-of-filing-of-the-thirty-third-substantive-amendment-to-the>
|
||||
|
||||
<https://www.federalregister.gov/documents/2020/01/14/2020-00363/consolidated-tape-association-notice-of-filing-of-the-thirtieth-substantive-amendment-to-the-second>
|
||||
|
||||
<https://www.federalregister.gov/documents/2020/01/14/2020-00357/joint-industry-plan-notice-of-filing-of-the-forty-fourth-amendment-to-the-joint-self-regulatory>
|
||||
|
||||
<https://www.federalregister.gov/documents/2020/01/14/2020-00360/notice-of-proposed-order-directing-the-exchanges-and-the-financial-industry-regulatory-authority-to>
|
||||
|
||||
Odd lots are a very important part of these change proposals, and here I link the submissions that Citadel (and by contract, Blackrock) made on them. I believe Odd lots to be an integral part of how Citadel hides trades, and will be writing more about them in a further DD.
|
||||
|
||||
<https://www.theice.com/publicdocs/SIP_Comment_Citadel_redacted.pdf>
|
||||
|
||||
<- Citadel commenting on Odd lot NMS proposal
|
||||
|
||||
<https://www.theice.com/publicdocs/BlackRock_Odd_Lot_Proposal_December_3_2019.pdf>
|
||||
|
||||
<- Blackrock comments on Odd lots NMS proposal
|
||||
|
||||
I have briefly covered these changes before in this [DD](https://www.reddit.com/r/Superstonk/comments/n90gg4/sec_release_3490610_aka_nms20_effective_june_8/), but basically the NMS II from what I can tell - contains multiple changes that would hurt Citadel's business model. What I'm suggesting is that Ken Griffin was annoyed with Trump that Jay Clayton & the SEC was making changes beneficial to other market participants, to Citadel's detriment. This DD is all circumstantial evidence, as I realized it was becoming too large to attach to the main DD, which will be focused more on mechanisms rather than trying to discover motivations & allegiances from public information.
|
||||
|
||||
To be continued.
|
||||
|
||||
Miscellaneous references
|
||||
|
||||
<https://www.reuters.com/article/china-regulator-goldman-idUSH9N22400P>
|
||||
|
||||
<https://www.reuters.com/article/us-hedgefunds-deliveringalpha-citadel-idUSKBN1K8252>
|
||||
|
||||
<https://www.pressreader.com/china/global-times/20170526/282119226489179>
|
||||
|
||||
<https://www.reuters.com/article/china-regulator-goldman-idUSH9N22400P>
|
||||
|
||||
<https://asia.nikkei.com/Business/Markets/Stocks/Stock-falls-after-admission-of-probe>
|
||||
|
||||
<https://www.reuters.com/article/china-guosen-president-idUSL3N12N3QF20151023>
|
||||
|
||||
<https://www.scmp.com/business/markets/article/1846104/us-hedge-fund-citadel-banned-share-trading-shanghai-account>
|
||||
|
||||
<https://supchina.com/2020/02/04/was-chinas-97-million-fine-for-u-s-hedge-fund-citadel-politically-motivated/>
|
||||
|
||||
<https://www.wsj.com/articles/after-a-four-year-freeze-citadel-securities-can-trade-again-in-china-11579526314>
|
||||
@ -0,0 +1,63 @@
|
||||
Calls/Puts Confirmed As Unreported Synthetic Short Shares - FINRA; Unsuccessful Attempt by MM/HF to Death Spiral GME Shows Correlation to Margin Debt
|
||||
=====================================================================================================================================================
|
||||
|
||||
| Author | Source |
|
||||
| :----: | :----: |
|
||||
| [u/Freadom6](https://www.reddit.com/user/Freadom6/) | [Reddit](https://www.reddit.com/r/Superstonk/comments/oh09v7/callsputs_confirmed_as_unreported_synthetic_short/) |
|
||||
|
||||
---
|
||||
|
||||
|
||||
[DD 👨🔬](https://www.reddit.com/r/Superstonk/search?q=flair_name%3A%22DD%20%F0%9F%91%A8%E2%80%8D%F0%9F%94%AC%22&restrict_sr=1)
|
||||
|
||||
Obligatory: Not financial advice. I am merely pointing out some items I have stumbled across during my late nights reading regulatory documents. Much of what I will discuss is my speculative opinion on information I am reading and using deductive reasoning to put this information together.
|
||||
|
||||
TL;dr FINRA confirms calls/puts used to create "synthetic shorts". I have pointed this out in a prior DD but used a bad title on the post. See my profile or [this link](https://www.reddit.com/r/Superstonk/comments/ofmswd/finra_requests_comment_on_short_interest_position/?utm_source=share&utm_medium=web2x&context=3) for my past DD on this...
|
||||
|
||||
Margin Debt has rocketed up just prior to the previous two recessions since 2000 (DOTCOM/Housing crashes) and it is currently on its largest rapid increase since the 2008 crash, but this time it is going substantially higher in a very short amount of time. When did this rapid margin debt ascent begin? When GME share pricing started turning glorious green in August of 2020. I believe Market Makers/Hedge Funds have been leveraging short sales in margin accounts on GME and other meme stocks and that is the cause of the current levels of margin debt. Don't want to read anymore? I don't blame you in the slightest. Look at the charts at the end of the post.
|
||||
|
||||
SKIP THIS PART IF YOU SAW MY LAST POST.
|
||||
|
||||
PUTS/CALLS Used as SYNTHETIC SHORTS and are NOT REPORTED, Confirmed by FINRA:
|
||||
|
||||
[Regulatory Notice 21-19](https://www.finra.org/rules-guidance/notices/21-19)
|
||||
|
||||
As my previous DD showed, FINRA has confirmed that synthetic shorts are being created through Call/Put Options and that information is not included in the current short interest reporting numbers. My apologies as I should have titled the post that way, so it got more visibility for those who wanted to see it. Direct quote from regulatory notice:
|
||||
|
||||
"enhanced short interest reporting could include synthetic short positions achieved through the sale of a call option and purchase of a put option (where the options have the same strike price and expiration month) or through other strategies."
|
||||
|
||||
For additional information on Regulatory Notice 21-19, see my previous DD or go to the link above for the actual Regulatory Notice.
|
||||
|
||||
OKAY, ON TO THE SUBJECT AT HAND:
|
||||
|
||||
What are Margin Accounts?
|
||||
|
||||
"A customer who purchases securities may pay for the securities in full or may borrow part of the purchase price from his or her securities firm. If the customer chooses to borrow funds from a firm, the customer will open a margin account with the firm. The portion of the purchase price that the customer must deposit is called margin and is the customer's initial equity in the account. The loan from the firm is secured by the securities that are purchased by the customer. A customer may also enter into a short sale through a margin account, which involves the customer borrowing stock from a firm in order to sell it, hoping that the price will decline. Customers generally use margin to leverage their investments and increase their purchasing power. At the same time, customers who trade securities on margin incur the potential for higher losses." [FINRA Defines Margin Account](https://www.finra.org/investors/learn-to-invest/advanced-investing/purchasing-margin)
|
||||
|
||||
My Interpration of Current Margin Debt Levels and Why Levels are Rapidly Elevating
|
||||
|
||||
Steady, slow increasing margin debt is expected in a robust and flourishing economy. It means the consensus is that the economy is strong and heading in the right direction and investors are willing to take on the risk associated with borrowing in a margin account because they feel the reward outweights the risk. Steadily declining margin debt would indicate the potential for a bear type sentiment or recession as investors are not willing to take on the risk of borrowing.
|
||||
|
||||
I have not been able to find many well written articles on rapid increases or decreases to Margin Debt from reputable sources, so I have taken it upon myself to chart the monthly reported margin debt numbers compared to the monthly (1st of the month) S&P 500 share prices. As you will see below, we have had two recessions since 2000 with the DOTCOM/Housing crashes. Prior to the crashes, Margin Debt RAPIDLY increased just like it has been doing since August of 2020. However, the increase this time is even more rapid and at substantially higher levels.
|
||||
|
||||
In prior years, Market Makers (MM), hedge funds (HF), etc. found that brick-and-mortar stores were a dying breed with the increase in online shopping and they realized they could make mountains (not piles) of money from naked shorting these businesses into a "[Death-Spiral](https://en.wikipedia.org/wiki/Death_spiral_financing)" where the ultimate result is the bankruptcy of the company, which means the borrowed shares do not need to be returned to the lender because the stock ceases to exist, which in turn leads to full profitability for the MM/HF aside from the fees associated with borrowing the stock to short.
|
||||
|
||||
If you were a MM or HF and you have found it to be highly lucrative (especially when fines for naked shorting are peanuts compared to profits) to bury companies in a death spiral scenario EVERY TIME YOU DO IT (Blockbuster, Toys-R-Us, Sears, etc.) would you feel comfortable using margin to continue doing this to other businesses? Maybe shorting more than 140% of the available float of a company's stock? I would not, but that is only because I am NOT a GIANT bag of shit. Remember, money sitting in the bank does nothing for these guys, it is best to have all your cash in play so you are making a profit on it versus losing value to inflation while sitting peacefully in a bank account. Some people would think that is a stupid idea (myself included), but if you had the ability to control a lot of the share pricing regarding securities through illegal and manipulative tactics, like MM's do, you are not overly concerned with the risk. Especially when death spiraling has worked every time before.
|
||||
|
||||
But what would happen if a company so severely shorted reimagined itself, found a large and dedicated shareholder base, and became profitable when the short interest is this high? Enter GAMESTOP. As you will see from the charts below, GME began showing significant positive share price movement in August of 2020. What happened to Margin Debt when Gamestop share prices went up? Margin Debt abso-fucking-lutely EXPLODED.
|
||||
|
||||
[](https://preview.redd.it/6zyntbass7a71.jpg?width=558&format=pjpg&auto=webp&s=1ccb5a9307aeab561438a541af100e8794207275)
|
||||
|
||||
Margin Debt 1997 - Current (Source: FINRA)
|
||||
|
||||
[](https://preview.redd.it/1j6w8gf4t7a71.jpg?width=555&format=pjpg&auto=webp&s=30ecc48bbca580af33be9fb090e09cf92323f5b4)
|
||||
|
||||
S&P Share Price 1997 - May 2021 (Source: https://www.multpl.com/s-p-500-historical-prices/table/by-month)
|
||||
|
||||
June margin debt numbers will be interesting to keep an eye on if we haven't begun our long awaited journey by that time. The numbers should be released by the 15th of this month.
|
||||
|
||||
My head hurts.
|
||||
|
||||
Hedgies R Fuk'd.
|
||||
|
||||
Tanks fo' readin.
|
||||
@ -0,0 +1,143 @@
|
||||
Hyperinflation is Coming- The Dollar Endgame: PART 1, "A New Rome"
|
||||
==================================================================
|
||||
|
||||
| Author | Source |
|
||||
| :----: | :----: |
|
||||
| [u/peruvian_bull](https://www.reddit.com/user/peruvian_bull/) | [Reddit](https://www.reddit.com/r/Superstonk/comments/o4vzau/hyperinflation_is_coming_the_dollar_endgame_part/) |
|
||||
|
||||
---
|
||||
|
||||
|
||||
[DD 👨🔬](https://www.reddit.com/r/Superstonk/search?q=flair_name%3A%22DD%20%F0%9F%91%A8%E2%80%8D%F0%9F%94%AC%22&restrict_sr=1)
|
||||
|
||||
I am getting increasingly worried about the amount of warning signals that are flashing red for hyperinflation- I believe the process has already begun, as I will lay out in this paper. The first stages of hyperinflation begin slowly, and as this is an exponential process, most people will not grasp the true extent of it until it is too late. I know I'm going to gloss over a lot of stuff going over this, sorry about this but I need to fit it all into four posts without giving everyone a 400 page treatise on macro-economics to read. Counter-DDs and opinions welcome. This is going to be a lot longer than a normal DD, but I promise the pay-off is worth it, knowing the history is key to understanding where we are today.
|
||||
|
||||
SERIES TL/DR (PARTS 1-4): We are at the end of a MASSIVE debt supercycle. This 80-100 year pattern *always* ends in one of two scenarios- default/restructuring (deflation a la Great Depression) or inflation( hyperinflation in severe cases (a la Weimar Republic). The United States has been abusing it's privilege as the World Reserve Currency holder to enforce its political and economic hegemony onto the Third World, specifically by creating massive artificial demand for treasuries/US Dollars, allowing the US to borrow extraordinary amounts of money at extremely low rates for decades, creating a [Sword of Damocles](https://idioms.thefreedictionary.com/a+sword+of+Damocles+hangs+over+head) that hangs over the global financial system. The massive debt loads have been transferred worldwide, and sovereigns are starting to call our bluff. Systemic risk within the US financial system (from derivatives) has built up to the point that collapse is all but inevitable, and the Federal Reserve has demonstrated it will do whatever it takes to defend legacy finance (banks, broker/dealers, etc) and government solvency, even at the expense of everything else (The US Dollar).
|
||||
|
||||
I'll break this down into four parts. ALL of this is interconnected, so please read these in order:
|
||||
|
||||
- Part One: The Global Monetary System- "A New Rome" < (YOU ARE HERE)
|
||||
|
||||
- [Part Two: Derivatives, Systemic Risk, & Nitroglycerin](https://www.reddit.com/r/Superstonk/comments/o727oc/the_dollar_endgame_part_2_the_ouroboros/)- "The Ouroboros" <
|
||||
|
||||
- Part Three: Banks, Debt Cycles & Avalanches- "The Money Machine" <
|
||||
|
||||
- Part Four: Financial Gravity & the Fed's Dilemma- "At World's End" <
|
||||
|
||||
Preface:
|
||||
|
||||
Some terms you need to know:
|
||||
|
||||
[Inflation](https://www.investopedia.com/terms/i/inflation.asp): Commonly refers to increase in prices (per Keynesian thinking). However, Inflation in the truest sense is inflation (growth) of the money supply- higher prices are just the RESULT of monetary inflation. (Think, in normal terms, prices really only rise/fall, same with temperatures. (ie Housing prices rose today). The word Inflation refers to a growth in multiple directions (quantity and velocity). Deflation means a contraction of the money supply, which results in falling prices.
|
||||
|
||||
[Dollarization](https://www.investopedia.com/terms/d/dollarization.asp#:~:text=Dollarization%20is%20the%20term%20for,due%20to%20hyperinflation%20or%20instability.) (Weaponization of the Dollar): The process by which the US government, IMF, World Bank, and other elite organizations force countries to adopt dollar systems and therefore create indirect demand for dollars, supporting its value. (Think Petrodollars).
|
||||
|
||||
[Central Banks](https://www.investopedia.com/terms/c/centralbank.asp): Generally these are banks that control/monitor the monetary policy of the country they reside in. They are usually owned by private financial institutions (large banks/bank holding firms). They utilize open market [operations](https://www.investopedia.com/terms/o/openmarketoperations.asp#:~:text=Open%20market%20operations%20(OMO)%20refers,out%20to%20businesses%20and%20consumers.) to stabilize and set market rates. They are called the "Lender of Last Resort" as they are supposed to LEND (not bailout/buy assets) to other banks in a crisis and help defend their currency's value in international forex markets. CBs are beholden to the "[dual mandate](https://www.chicagofed.org/research/dual-mandate/dual-mandate)" of maintaining price stability (low inflation) and a strong job market (low unemployment)
|
||||
|
||||
[Monetary Policy](https://www.investopedia.com/terms/m/monetarypolicy.asp): The set of tools that central bankers have to adjust how money moves through the financial system. The main tool they use is quantitative tightening/easing, which basically means selling treasuries or buying treasuries, respectively. *A quick note- bond prices and interest rates move inversely to one another, so when Central banks buy bonds (easing), they lower interest rates; and when they sell bonds (tightening), they increase interest rates.
|
||||
|
||||
[Fiscal Policy](https://www.investopedia.com/terms/f/fiscalpolicy.asp): The actions taken by the government (mainly spending and taxing) to influence macroeconomic conditions. Fiscal policy and monetary policy are supposed to be enacted independently, so as not to allow massive mismanagement of the money supply to lead to extreme conditions (aka high inflation/hyperinflation or deflation) *cough Yellen cough*
|
||||
|
||||
Part One: The Global Monetary System- A New Rome
|
||||
|
||||
[](https://preview.redd.it/7sgzws8mlm671.png?width=557&format=png&auto=webp&s=956c8e050e84de9715eb2c7e4aeee59910f38d3a)
|
||||
|
||||
Allegory of the Prisoner's Dilemma
|
||||
|
||||
Prologue:
|
||||
|
||||
In their masterwork tapestry entitled "[Allegory of the Prisoner's Dilemma](https://loloro.com/artwork/3552148-Allegory-of-the-Prisoner-s-Dilemma.html)" (pictured in the title image of this post) the artists Diaz Hope and Roth visually depict a great tower of civilization that rests upon a bedrock of human cooperation and competition across history. The artists force us to confront the fact that after 10,000 years of human civilization we are now at a cross-roads. Today we have the highest living standards in human history that co-exists with an ability to destroy our planet ecologically and ourselves through nuclear war. We are in the greatest period of stability with the largest probabilistic tail risk ever. The majority of Americans have lived their entire lives without ever experiencing a direct war and this is, by all accounts, rare in the history of humankind. Does this mean we are safe? Or does the risk exist in some other form, transmuted and changed by time and space, unseen by most political pundits who brazenly tout perpetual American dominance across our screens? ([Pulled from Artemis Capital Research Paper](https://artemiscm.docsend.com/view/t2rpfyivddgqg6n8))
|
||||
|
||||
The Bretton Woods Agreement
|
||||
|
||||
[Money](https://www.investopedia.com/terms/m/money.asp), in and of itself, might have actual value; it can be a shell, a metal coin, or a piece of paper. Its value depends on the importance [that people place on it](https://www.investopedia.com/insights/what-is-money/)---traditionally, money functions as a medium of exchange, a unit of measurement, and a storehouse for wealth (what is called the three factor definition of money). Money allows people to trade goods and services indirectly, it helps communicate the price of goods (prices written in dollar and cents correspond to a numerical amount in your possession, i.e. in your pocket, purse, or wallet), and it provides individuals with a way to store their wealth in the long-term.
|
||||
|
||||
Since the inception of world trade, merchants have attempted to use a single form of money for international settlement. In the 1500s-1700s, the Spanish silver peso (where we derive the [$ sign](https://www.lexico.com/explore/what-is-the-origin-of-the-dollar-sign)) was the standard- by the 1800s and early 1900s, the British rose to prominence and the Pound (under a gold standard) became the de facto world reserve currency, helping to boost the UK's military and economic dominance over much of the world. After World War 1, geopolitical power started to shift to the US, and this was cemented in 1944 at [Bretton Woods](https://en.wikipedia.org/wiki/Bretton_Woods_system), where the US was designated as the WRC (World Reserve Currency) holder.
|
||||
|
||||
[](https://preview.redd.it/gw3dze1plm671.png?width=774&format=png&auto=webp&s=270e50cd07607e6e8c2f0254d954849cdb443c82)
|
||||
|
||||
Bretton Woods
|
||||
|
||||
In the early fall of 1939, the world had watched in horror as the German blitzkrieg raced through Poland, and combined with a simultaneous Russian invasion, had conquered the entire territory in 35 days. This was no easy task, as the Polish army numbered more than [1,500,000 men](https://www.ww2-weapons.com/polish-armed-forces/), and was thought by military tacticians to be a tough adversary, even for the industrious German war machine. As WWII continued to heat up and country after country fell to the German onslaught, European countries, fretting over possible invasions of their countries and annexation of their gold, started sending massive amounts of their [Gold Reserves to the US](https://www.stlouisfed.org/publications/regional-economist/first-quarter-2020/changing-relationship-trade-americas-gold-reserves). At one point, the Federal Reserve held over 50% of all above-ground reserves in the world.
|
||||
|
||||
[](https://preview.redd.it/40yylu9qlm671.png?width=783&format=png&auto=webp&s=57a4cfabc73c8b074da57f68980467e834055f62)
|
||||
|
||||
US Trade Balance
|
||||
|
||||
In a global monetary system restrained by a Gold Standard, countries HAVE to have [gold reserves](https://en.wikipedia.org/wiki/Gold_reserve) in their vaults in order to issue paper currency. The Western European powers all exited the Gold standard via executive acts in the during the dark days of the Great Depression (in Germany's case, immediately after WW1) and build up to War by their respective finance ministers, but the understanding was they would return back to the Gold standard, or at least some form of it, after the chaos had subsided. As the war wound down, and it became clear that the Allies would win, the Western Powers understood that they would need to come to a new consensus on the creation of a new global monetary and economic system. Britain, the previous world superpower, was marred by the war, and had seen most of her industrial cities in ruin from the [Blitz](https://www.britannica.com/event/the-Blitz). France was basically in tatters, with most industrial infrastructure completely obliterated by German and American shelling during various points of the war. The leaders of the Western world looked ahead to a long road of rebuilding and recovery. The new threat of the USSR loomed heavy on the horizon, as the Iron Curtain was already taking shape within the territories re-conquered by the hordes of Red Army. Realizing that it was unsafe to send the gold back from the US, they understood that a post-war economic system would need a new World Reserve Currency. The US was the de-facto choice as it had massive reserves and huge lending capacity due to its untouched infrastructure and incredibly productive economy.
|
||||
|
||||
At Bretton Woods, the consortium of nations assented to an [agreement](https://corporatefinanceinstitute.com/resources/knowledge/finance/bretton-woods-agreement/) whereby the Dollar would become the WRC and the participating nations would [synchronize monetary policy](https://ies.princeton.edu/pdf/E106.pdf) to avoid competitive devaluation. In summary, they could still redeem dollars for Gold at a fixed rate of $35 an oz, a hard redemption peg which the[ U.S would defend](https://www.thebalance.com/gold-price-history-3305646). Thus they entered into a quasi- Gold standard, where citizens and private corporations could NOT redeem dollars for Gold (due to the [Gold Reserve Act ](https://en.wikipedia.org/wiki/Gold_Reserve_Act), c. 1934), but sovereign governments (Central banks) could still redeem dollars for gold. Since their currencies (like the Franc and Pound) were pegged to the Dollar, and the Dollar pegged to gold, all countries remained connected indirectly to a gold standard, stabilizing their currency conversion rate to each other and limiting local governments' ability to print and spend recklessly.
|
||||
|
||||
[](https://preview.redd.it/6pqkimnwlm671.png?width=746&format=png&auto=webp&s=a2d3e71f7fe4462d7157d0a54e45c2f5f63b8e51)
|
||||
|
||||
US Gold Reserves
|
||||
|
||||
For a few decades, this system worked well enough. US economic growth spurred European rebuilding, and world trade continued to increase. Cracks started to appear during the Guns and Butter era of the 1960's, when Vietnam War spending and Johnson's Great Society programs spurred a new era of fiscal [profligacy](https://www.thebalance.com/president-lyndon-johnson-s-economic-policies-3305561). The US started borrowing massively, and dollars in the form of Treasuries started stacking up in foreign Central Banks reserve accounts.
|
||||
|
||||
Then-French President [Charles De Gaulle](https://www.britannica.com/biography/Charles-de-Gaulle-president-of-France/Return-to-public-life) did the calculus and realized in 1965 that the US had issued far too many dollars, even considering the massive gold reserves they had, to ever redeem all dollars for gold (remember naked shorting more shares than exist? -same idea here). He laid out this argument in his infamous [Criterion Speech](https://www.usagold.com/cpmforum/favorite-web-pages-degaulle/) and began aggressively redeeming dollars for gold. The global "run on the dollar" had already begun, but the process accelerated after his seminal address, as every large sovereign turned in their dollars for bullion, and the US Treasury was forced to start massively exporting gold. Backing the sovereign government's actions were fiscal and monetary strategists getting more and more worried that the US would not have enough gold to redeem their dollars, and they would be left holding a bag of worthless paper dollars, backed by nothing but promises. The outward flow of gold quickly became a deluge, and policymakers at all levels of Treasury and the State department started to worry.
|
||||
|
||||
[](https://preview.redd.it/n2o4uz5ylm671.png?width=761&format=png&auto=webp&s=02ce74f1d61b5fa8c920db23af4c87bff8e2e2d2)
|
||||
|
||||
Nixon ends Bretton Woods
|
||||
|
||||
Nearing a coming dollar solvency crisis, Richard Nixon [announced](https://www.federalreservehistory.org/essays/gold-convertibility-ends) on August 15th, 1971 that he was closing the [gold window](http://triplecrisis.com/a-first-default-closing-the-gold-window/), effectively barring all countries from current and future gold redemptions. Money ceased to be based on the gold in the Treasury vaults, and instead was now completely unbacked, based solely on government decree, or [fiat](https://www.investopedia.com/terms/f/fiatmoney.asp). Fixed wage and price controls were created, inflation skyrocketed, and unemployment spiked.
|
||||
|
||||
Nixon's speech was not received as well internationally as it was in the United States. Many in the international community interpreted Nixon's plan as a unilateral act. In response, the [Group of Ten](https://www.investopedia.com/terms/g/groupoften.asp) (G-10) industrialized democracies decided on new exchange rates that centered on a devalued dollar in what became known as the [Smithsonian Agreement](https://www.investopedia.com/terms/s/smithsonian-agreement.asp). That plan went into effect in Dec. 1971, but it proved unsuccessful. Beginning in Feb. 1973, speculative market pressure caused the USD to devalue and led to a series of [exchange parities](https://www.investopedia.com/terms/p/parity.asp).
|
||||
|
||||
Amid still-heavy pressure on the dollar in March of that year, the G--10 implemented a strategy that called for six European members to tie their currencies together and jointly [float](https://www.investopedia.com/terms/f/float.asp) them against the dollar. That decision essentially brought an end to the fixed exchange rate system established by Bretton Woods. This crisis came to be known as the "[Nixon Shock](https://www.investopedia.com/terms/n/nixon-shock.asp)" and the DXY ([US dollar index) began to fall](https://www.macrotrends.net/1329/us-dollar-index-historical-chart) in global markets.
|
||||
|
||||
[](https://preview.redd.it/jioirg70mm671.png?width=754&format=png&auto=webp&s=e81e3ab7724a05947925e436657a05e8d5ed6c5e)
|
||||
|
||||
DXY
|
||||
|
||||
This crisis came out of the blue for most members of the administration. According to [Keynesian](https://www.econlib.org/library/Enc/KeynesianEconomics.html) economists, stagflation was literally impossible, as it was a violation of the [Philips Curve](https://www.econlib.org/library/Enc/PhillipsCurve.html) principle, where Unemployment and Inflation were inversely correlated, thus inflation should [theoretically](https://www.stlouisfed.org/open-vault/2020/january/what-is-phillips-curve-why-flattened) be decreasing as the recession worsened and unemployment climbed through [1973-1975](https://en.wikipedia.org/wiki/1973%E2%80%931975_recession#:~:text=The%201973%E2%80%931975%20recession%20or,World%20War%20II%20economic%20expansion.).
|
||||
|
||||
[](https://preview.redd.it/865d1fr1mm671.png?width=705&format=png&auto=webp&s=ee8be1d79e2323da9f0f19ecc39c0da0a3360511)
|
||||
|
||||
Phillips Curve
|
||||
|
||||
MONKE-SPEK: Philips Curve Explained
|
||||
|
||||
- Low Unemployment>Lots of jobs/high demand for labor.
|
||||
|
||||
- Thus, more workers are employed, and wages rise>putting more money in more people's pockets.
|
||||
|
||||
- These people go out and buy beanie babies, toasters, and bananas (what economist John Maynard Keynes called [aggregate demand](https://www.investopedia.com/terms/a/aggregatedemand.asp)) and this higher demand leads to higher prices for goods and services. This shows up as inflation.
|
||||
|
||||
- Consider the opposite- high unemployment>fewer jobs>less money for people
|
||||
|
||||
- Less demand for goods and services> lower inflation
|
||||
|
||||
Keynesian economists treated this curve as a law of nature, rather than a general rule. We see exceptions to this rule everywhere- Argentina is a prime example, where they have [persistently](https://www.statista.com/statistics/316703/unemployment-rate-in-argentina/) high unemployment AND high [inflation](https://tradingeconomics.com/argentina/inflation-cpi). This phenomenon is called [stagflation](https://www.investopedia.com/terms/s/stagflation.asp), and is evidence of inflationary pressures so strong that they overcome the deflationary force of high unemployment. These economists were utterly blindsided by the emergence of stagflation.
|
||||
|
||||
After the closing of the gold window in 1971, the crisis spread, inflation kept climbing, and other sovereigns began contemplating devaluing their currencies as their only peg, the US dollar, was now unmoored and looked to be heading to disaster. US exports started climbing (cheaper dollar, foreigners could now import stuff to their countries), straining export economies and sparking talks of a [currency war](https://en.wikipedia.org/wiki/Currency_war). Knowing they had to do something to stop the bleeding, the Nixon administration, at the direction of Henry Kissinger, made a secret deal with [OPEC](https://en.wikipedia.org/wiki/OPEC), creating what is now called the Petrodollar system. This [article](https://greatpowerrelations.com/great-powers/status-of-great-powers/key-drivers-of-economic-capabilities/dollar-and-de-dollarization/birth-of-petrodollar/) summarizes it best:
|
||||
|
||||
[](https://preview.redd.it/m5a1v6a4mm671.png?width=787&format=png&auto=webp&s=b8ff7945a9bbe8924be32f157864c67a0db4cb41)
|
||||
|
||||
PetroDollar system
|
||||
|
||||
[Petrodollars](https://www.investopedia.com/terms/p/petrodollars.asp) had been around since the late 1940s, but only with a few suppliers. Petrodollars are U.S. dollars paid to an oil-exporting country for the sale of the commodity. Put simply, the petrodollar system is an exchange of oil for U.S. dollars between countries that buy oil and those that produce it. By forcing the majority of the oil producers in the world to price contracts in dollars, it created artificial demand for dollars, helping to support US dollar value on foreign exchange markets. The petrodollar system creates surpluses for oil producers, which lead to large U.S. dollar reserves for oil exporters, which need to be recycled, meaning they can be channeled into loans or direct investment back in the United States.
|
||||
|
||||
It still wasn't enough. [Inflation](https://fred.stlouisfed.org/series/FPCPITOTLZGUSA), like many things, had inertia, and the oil shocks caused by the Yom Kippur War and other geo-political events continued to strain the economy through the 1970's.
|
||||
|
||||
[](https://preview.redd.it/l89uq1v5mm671.png?width=782&format=png&auto=webp&s=3673060f2a7a4492bafae2ef07d0a33f3442f649)
|
||||
|
||||
PCE Index
|
||||
|
||||
Running out of road, monetary policymakers finally decided to employ the nuclear option. [Paul Volcker](https://www.thebalance.com/who-is-paul-volcker-3306157), the new Federal Reserve Chairman selected in 1979, knew that it was imperative to break the back of inflation to preserve the global economic system. That year, inflation was spiking well above 10%, with no end in sight. He decided to do something about it.
|
||||
|
||||
[](https://preview.redd.it/ytyvtld7mm671.png?width=786&format=png&auto=webp&s=d0be2afbd5e646ee7afa70c4bac738796029ff97)
|
||||
|
||||
Volcker Doctrine
|
||||
|
||||
By hiking interest rates aggressively, consumer credit lending slowed, mortgages became more expensive to finance, and corporate debt became more expensive to borrow. Foreign companies that had been dumping US dollar holdings as inflation had risen now had good reason to keep their funds vested in US accounts. When the Petrodollar system, which had started taking shape in '73 was completed in March 1979 under the [US-Saudi Joint Commission](https://www.legistorm.com/reports/view/gao/6895/The_U_S_Saudi_Arabian_Joint_Commission_on_Economic_Cooperation.html), the dollar finally began to stabilize. The worst of the crisis was over.
|
||||
|
||||
Volcker had to keep interest rates elevated well above 8% for most of the decade, to shore up support for the dollar and assure foreign creditors that the Fed would do whatever it takes to defend the value of the dollar in the future. These absurdly high interest rates put a brake to US government borrowing, at least for a few years. Foreign creditors breathed a sigh of relief as they saw that the Fed would go to extreme lengths to preserve the value of the dollar and ensure that Treasury bonds paid back their principal + interest in real terms.
|
||||
|
||||
[](https://preview.redd.it/8wmho589mm671.png?width=775&format=png&auto=webp&s=7af6f7393d964baeabd3ff69eeb876ef70bace1e)
|
||||
|
||||
10yr US treasury yields
|
||||
|
||||
Over the next 40 years, the United States and most of the developed world saw a prolonged period of economic growth and global trade. Fiat money became the norm, and creditors accepted the new paradigm, with it's new risk of inflation/devaluation (under the gold standard, current account deficits, and thus inflation risk, was self-stabilizing). The Global Monetary system now consisted of free-floating fiat currencies, liberated from the fetters of the gold system.
|
||||
|
||||
[(I had to break this post up into two sections due to the character limit, here is second half of Pt 1): /](https://www.reddit.com/r/Superstonk/comments/o4w45f/hyperinflation_is_coming_the_dollar_endgame_part/)
|
||||
@ -0,0 +1,123 @@
|
||||
Hyperinflation is Coming- The Dollar Endgame: PART 1, "A New Rome"
|
||||
==================================================================
|
||||
|
||||
| Author | Source |
|
||||
| :----: | :----: |
|
||||
| [u/peruvian_bull](https://www.reddit.com/user/peruvian_bull/) | [Reddit](https://www.reddit.com/r/Superstonk/comments/o4w45f/hyperinflation_is_coming_the_dollar_endgame_part/) |
|
||||
|
||||
---
|
||||
|
||||
|
||||
[DD 👨🔬](https://www.reddit.com/r/Superstonk/search?q=flair_name%3A%22DD%20%F0%9F%91%A8%E2%80%8D%F0%9F%94%AC%22&restrict_sr=1)
|
||||
|
||||
(this is a second half of Pt 1 of the endgame series, find the first half of Pt 1 [here](https://www.reddit.com/r/Superstonk/comments/o4vzau/hyperinflation_is_coming_the_dollar_endgame_part/))
|
||||
|
||||
Dollar Hegemony
|
||||
|
||||
Ok, let's go over this for a second. Let us say you are the President of a country like [Liberia](https://en.wikipedia.org/wiki/Liberia), a small West African nation, looking to enter global trade. You go talk to the International Monetary Fund, whose economists tell you in order to be a modern economy you need to have your own currency. Thus, you need a Central Bank to print your own currency (LD), which will be used as [legal tender](https://www.investopedia.com/terms/l/legal-tender.asp), enforced by your government. Your Central bank will act as a lender of last resort for all the commercial and investment banks in your country, and will be responsible for stabilizing monetary policy.
|
||||
|
||||
But, there's an issue-the economists tell you that you CANNOT have your Central Bank store up your own currency as the majority of its [foreign exchange reserves](https://www.investopedia.com/terms/f/foreign-exchange-reserves.asp). Why? Well, if your currency comes under attack in the global [Forex](https://www.investopedia.com/terms/forex/f/forex-market.asp) markets, you will have to defend it. If your currency trade value is too high, it's easy to fight- you just print your own currency and buy Euros (EU) or Dollars (USD), flooding the market with your currency and taking other currencies out of the market- "[devaluing your currency](https://www.investopedia.com/terms/d/devaluation.asp#:~:text=Devaluation%20is%20the%20deliberate%20downward%20adjustment%20of%20a%20country%27s%20currency,can%20help%20shrink%20trade%20deficits.)" . However, if the inverse is true, and your currency is losing value in the market, printing more to flood the market will only make it worse. You need a stable currency, like bullets in the chamber, to utilize to buy your currency at the market rate, to support its value and drive it back up. This form of currency defense is called "defending the [peg](https://www.investopedia.com/terms/c/currency-peg.asp)" (Post-1971, the peg is floating, so it's more of a range, but it's still referred to loosely as a peg).
|
||||
|
||||
This exact phenomenon played out during the[ Asian Financial Crisis](https://www.thebalance.com/what-was-the-asian-financial-crisis-1978997) of 1997, a classic case study in global monetary crises. Thailand had grown rapidly as world trade boomed in the 1980s and 90s, and its corporate and real estate sectors took on massive amounts of debt. A massive real estate and financial bubble formed (does this sound familiar)? Soon, the bubble started to pop:
|
||||
|
||||
[](https://preview.redd.it/fbnpc1k7nm671.png?width=777&format=png&auto=webp&s=717ebf418b3ee627e15013c5a3dfab22f9fb8c0a)
|
||||
|
||||
Thai Financial Crisis
|
||||
|
||||
Thailand's hand was forced, and the Thai Central Bank decided to devalue its currency relative to the US dollar. This development, which followed months of speculative downward pressures on their currency that had substantially depleted Thailand's official foreign exchange reserves, marked the beginning of a deep financial crisis across much of East Asia. In subsequent months, Thailand's currency, equity, and property markets weakened further as its difficulties evolved into a twin balance-of-payments and banking crisis. Malaysia, the Philippines, and Indonesia also allowed their currencies to weaken substantially in the face of market pressures, with Indonesia gradually falling into a multifaceted financial and political crisis.
|
||||
|
||||
[](https://preview.redd.it/0gh1phi9nm671.png?width=779&format=png&auto=webp&s=454d0bab7fd2d0b8df84b5fc600cb53253319d05)
|
||||
|
||||
Asian Financial Crisis
|
||||
|
||||
As the president of Liberia, you see what can happen when a country, especially a small third-world country, doesn't have enough dollar reserves to defend its own currency. Rippling currency devaluations, inflation, social and political unrest, widening economic inequality- the beginning of a death spiral of a country if you aren't careful. So, you tell the IMF that you agree to their terms. They impress upon you that you need to get your bank to buy up some other stable currency to hold as reserves, to defend against this very scenario. As the US dollar is the World Reserve Currency, you're going to hold it as the majority of your reserve position.
|
||||
|
||||
We've established the need for a small country to hold another currency on their balance sheet. If ONE small country does this, there is little impact on the US Dollar. However, under the current system, virtually [EVERY](https://faisalkhan.com/central-banks/) country has a central bank, and they all use the Dollar as their main reserve currency. This creates MASSIVE buying pressure on Treasuries. Using Liberia as an example, the process works like this:
|
||||
|
||||
[](https://preview.redd.it/ui054o3bnm671.png?width=806&format=png&auto=webp&s=53c4f55e236b5c840a59a67d974df35b085c294b)
|
||||
|
||||
Dollar Recycling
|
||||
|
||||
THIS is what French Finance Minister Valéry Giscard d'Estaing meant when during the 1960's he had contemptuously [called](https://www.brookings.edu/blog/ben-bernanke/2016/01/07/the-dollars-international-role-an-exorbitant-privilege-2/) this benefit the US enjoyed *le privilège exorbitant*, or the "[Exorbitant privilege](https://en.wikipedia.org/wiki/Exorbitant_privilege)". He understood that the United States would never face a[ Balance of Payments](https://en.wikipedia.org/wiki/Currency_crisis) (currency) crisis (*AS LONG AS THE USD IS THE WORLD RESERVE CURRENCY*), nor a debt crisis, due to forced buying of Treasuries (from Central Banks) and Dollars (from Petrodollar systeem). The US could borrow cheaply, spend lavishly, and not pay for it immediately. Instead, the payment for this privilege would build up in the form of debt and dollars overseas, held by foreigners all around the world. One day, the Piper HAS to be paid- but as long as the music is playing, and the punchbowl is out, everyone gets to party, dance & drink to their hearts' content, and the US can remain the[ belle of the ball](https://www.merriam-webster.com/dictionary/the%20belle%20of%20the%20ball).
|
||||
|
||||
Effectively, the US can print money, and get real goods. This means we can import consumer products for cheap, and the inflation we create gets exported to other countries. (ONE of the reasons why developing countries tend to have higher inflation). [Another way to explain it:](https://whatismoney.info/exporting-inflation/)
|
||||
|
||||
[](https://preview.redd.it/cdv48oqcnm671.png?width=782&format=png&auto=webp&s=919ec0bf7363987a0a9b0454db0fd3e7df5bcf2c)
|
||||
|
||||
Exporting Inflation, importing goods
|
||||
|
||||
As it is the WRC, other countries' Central Banks NEED to have US dollars on their balance sheet. Thus, the US has to run persistent [current account deficits](https://www.investopedia.com/ask/answers/010715/what-difference-between-current-account-deficit-and-trade-deficit.asp) in order to send out more dollars to the global system, on net, than it receives back. A major byproduct is [constant large and increasing trade deficits](https://www.stlouisfed.org/publications/regional-economist/third-quarter-2018/understanding-roots-trade-deficit) for the WRC holder (in a fiat money system).
|
||||
|
||||
This is what is known as [Triffin's dilemma](https://www.investopedia.com/financial-edge/1011/how-the-triffin-dilemma-affects-currencies.aspx): the WRC is HAS to run constant trade deficits. There are no immediate negative impacts, but in the long run this process is unsustainable, as the WRC country becomes unproductive (ever wonder why US manufacturing left) because the system forces the WRC holder to be a net importer. As world trade grows, the current account deficit/trade deficit grows, and the benefits (more goods to the US) and drawbacks (more dollars build up overseas) increase over time. Eventually the imbalance becomes so great that something snaps, just like it did for the [Pound post WWI](https://www.economicshelp.org/blog/5948/economics/uk-economy-in-the-1920s/), where policymakers chose the route of deflation in 1921, creating a Great depression for the UK long before the US ever experienced it.
|
||||
|
||||
[](https://preview.redd.it/pktv0cdfnm671.png?width=812&format=png&auto=webp&s=42ab9b7ea8502e518371bd8dcfc348d65344d040)
|
||||
|
||||
US Trade Deficit broken down by Goods/Services
|
||||
|
||||
This is why I laughed out loud when I heard Trump rail against our trade deficits in one of the 2016 presidential debates. He clearly did not understand how our system works, and that this issue was beneficial in the short term, but detrimental in the long term. Our trade deficits were symptoms of our system working exactly as intended. In fact, a large part of the reason why he was elected was the de-industrialization of the American heartland, where loss of economic vitality from manufacturing jobs was leading to rampant [drug abuse](https://blog.questdiagnostics.com/blog/2019/03/29/id-signs-of-drug-abuse-in-loved-one/), depression, and societal decay. I knew this process of deindustrialization [would only get worse with time](https://www.politico.com/news/2020/10/06/trump-trade-deficit-426805), and nothing he did (short of taking us off the WRC status) would change that. (Not political, other politicians say the same shit. They just don't understand the very system in which we operate).
|
||||
|
||||
Fast forward to today- After decades of this process playing out, Foreign Central Banks collectively hold huge amounts of Forex reserves, as you can see [below](https://www.visualcapitalist.com/countries-most-foreign-currency-reserves/) where countries are sized depending on their reserves of foreign currency exchange assets:
|
||||
|
||||
[](https://preview.redd.it/m7vql2rinm671.png?width=780&format=png&auto=webp&s=4adf109f9687378684818d67db55c8f74f9fd92d)
|
||||
|
||||
Central Banks FX Reserves
|
||||
|
||||
The majority of these [reserves are held in dollars](https://www.cfr.org/backgrounder/dollar-worlds-currency), mainly in the form of [Treasuries, T-bills, and other US government debt](https://fred.stlouisfed.org/series/BOGZ1FL263061130Q). Furthermore, the US Dollar continues to dominate global trade through the [SWIFT](https://www.investopedia.com/articles/personal-finance/050515/how-swift-system-works.asp) network (Society for Worldwide Interbank Financial Telecommunication). SWIFT is a payments system used by multinational banks, institutions, and corporations to settle trade worldwide. USD is the preferred payment method within the system, thus forcing other countries to adopt the dollar in international trade. This is one of the results of the petrodollar system we described earlier. Petrodollars originally were exclusively used to refer to oil contracts priced in USD from Saudi Arabia, but over time the name grew to mean any oil contract, transacted by non-US countries, using the US Dollar as the denomination.
|
||||
|
||||
[](https://preview.redd.it/7tyu7klknm671.png?width=693&format=png&auto=webp&s=aefe74220376e881f9d9c0db859d0bca8247c85e)
|
||||
|
||||
Most FX Reserves in Dollars
|
||||
|
||||
When Chile and South Africa trade copper, for example, they have to transact in dollars, because a SWIFT member bank in South Africa will not accept Chilean Pesos as payment, as there is a smaller, less liquid market for it and it doesn't want to take a trading loss when converting to a more usable currency. The contract itself is priced in USD, so if that merchant bank wants to sell it, they can quickly find a buyer. In fact, SWIFT itself published a [report](https://www.swift.com/node/19186#:~:text=The%20US%20dollar%20dominates%20as,regional%20currency%20usage%20in%20value.) in 2014, and found that the USD accounts for almost 80% of all world trade! (see top left)
|
||||
|
||||
[](https://preview.redd.it/fspge6omnm671.png?width=752&format=png&auto=webp&s=272a005bae77aee91dc1a83b9febdafb20b2dd2c)
|
||||
|
||||
Currencies as a % of Trade
|
||||
|
||||
This process is called dollarization, whereby the dollar is used as the medium of exchange for a contract, in place of some other currency, even between non-US trading partners (Iran and China for example). [Dollarization](https://www.investopedia.com/terms/d/dollarization.asp#:~:text=Dollarization%20is%20the%20term%20for,due%20to%20hyperinflation%20or%20instability.) (capital D) of a country occurs when a government switches from managing their own currency to just using the US dollar for trade settlement and tax revenue- like Ecuador, El Salvador, and Panama have [done](https://www.coha.org/examining-the-effects-of-dollarization-on-ecuador/). The US Dollar reserves from the petro-dollar system show up on the balance sheets of these overseas financial institutions; they are called [Euro-Dollars](https://www.investopedia.com/terms/e/eurodollar.asp), and these [USD denominated deposits](https://capitalistexploits.at/eurodollar-market-it-all-starts-here/) are not under the jurisdiction of the Treasury or Federal Reserve. If you want to read a brief history of the Euro-dollar market, check out this paper from the Federal Reserve bank of St. Louis [here](https://files.stlouisfed.org/files/htdocs/publications/review/80/06/Eurodollars_Jun_Jul1980.pdf). In 2016, the total value of the Eurodollar Market was estimated to be around [13.83 Trillion](https://www.nedbank.co.za/content/dam/nedbank-crp/reports/Strategy/NeelsAndMehul/2016/September/TheRiseAndFallOfTheEurodollarSystem_160907.pdf).
|
||||
|
||||
Through this process, the United States was able to become the [largest and most dominant military force](https://www.nytimes.com/interactive/2017/03/22/us/is-americas-military-big-enough.html) in the history of man, able to fight simultaneous two-theater wars with overseas supply lines. The Treasury could borrow and spend, unimpeded by the normal constraints of market discipline that were hoisted on other countries. Despite not declaring war since 1941, the US has been in a state of [near-continuous warfare](https://en.wikipedia.org/wiki/List_of_wars_involving_the_United_States).
|
||||
|
||||
[](https://preview.redd.it/smw5l4ugg1a71.png?width=822&format=png&auto=webp&s=b6d6d1b94957aa371040c66f188c456f20fa786d)
|
||||
|
||||
American Military Budget
|
||||
|
||||
At every turn, the US defended this system at all costs, even going so far as to directly invade and occupy the Middle East in the Gulf War in 1991 and the Iraq/Afghanistan War (2001-Present). As a result there are over [800](https://www.politico.com/magazine/story/2015/06/us-military-bases-around-the-world-119321#:~:text=Despite%20recently%20closing%20hundreds%20of,about%2030%20foreign%20bases%20combined.) US military [bases around the world](https://www.todaysmilitary.com/ways-to-serve/bases-around-world), in locales ranging from Turkey to Japan. American institutions like the Senate, Presidency, and Courts were modeled after their Roman antecedents, to the point that the American symbol, the Eagle, is the spitting image of the [Roman Aquila](https://en.wikipedia.org/wiki/Aquila_(Roman)) adorned on the [Standard](https://en.wikipedia.org/wiki/Roman_Empire_Standards) of the centurions.
|
||||
|
||||
[](https://preview.redd.it/ig1pp031g1a71.png?width=764&format=png&auto=webp&s=57ff0e910d0707cc6475c8e4c098eab0634b67fc)
|
||||
|
||||
Rome
|
||||
|
||||
Most scholars tout the story of Rome as a tale of triumphalism; of valiant centurions battling in the steppes of Asia, of brilliant generals laying traps for enemy armies, of scheming senators fighting battles of political intrigue, and of a sophisticated and well-functioning empire that harnessed engineering to create marvels such as the Colosseum and the Roman Aqueducts. [More sober historians](https://www.goodreads.com/book/show/19400.The_Decline_and_Fall_of_the_Roman_Empire?from_search=true&from_srp=true&qid=oZSKjoDHpx&rank=1), however, point out that the story of Rome is one that also echoes a warning through the annals of history. A complex society, with mighty political, legal, and financial institutions, supported by a massive military, fell not to a crushing enemy invasion, but to collapse and decay from within. An elite ruling class, detached from the realities of daily life of the citizens, oversaw an empire with growing income inequality, environmental degradation, political corruption, social deterioration, and economic despair, and did nothing to stop it. The Roman Treasury, facing insurmountable debts from years of fruitless war, started "clipping coins" an early form of currency debasement that led to the Roman denarii losing 25% of it's value every year. This eventually led to uprisings in Roman provinces and the [Sacking of Rome](https://en.wikipedia.org/wiki/Sack_of_Rome_(410))- the coup de grace, the final nail in the coffin for what had become the decadent [Western Roman empire](https://en.wikipedia.org/wiki/Fall_of_the_Western_Roman_Empire).
|
||||
|
||||
------------------------------------------------------------------------------------------------------------------------------------------------
|
||||
|
||||
Smooth Brain Overview:
|
||||
|
||||
- Petrodollars: Oil contracts priced in dollars means foreign companies need to have dollars to buy oil. This creates artificial demand for dollars as companies sell their local currency to buy USD.
|
||||
|
||||
- Triffin Dillema: As the US is WRC, other countries' Central banks need USDs. US thus runs deficits to push more $ out to the world to satisfy demand. This means cheap goods in the short term, but debt/dollar buildup overseas long term. Because of this, no country can remain WRC holder forever.
|
||||
|
||||
- Eurodollars: Due to the petrodollar system, USDs build up in overseas bank accounts. These dollars are used by SWIFT for most international payments, and are called Eurodollars (due to the fact that most US dollars after WW2 ended up in Europe). The size of this market is roughly $14T.
|
||||
|
||||
- Foreign Exchange Reserves: Due to the Triffin Dilemma & structure of WRC system, dollars build up in reserve accounts of foreign central banks. Wanting to earn interest on this cash, CBs invest in treasuries, effectively lending to the US Govt at low interest rate. [$4T of these treasuries](https://fred.stlouisfed.org/series/BOGZ1FL263061130Q) are held by these CBs, and [$2T of these treasuries](https://fred.stlouisfed.org/series/BOGZ1FL263061145Q) are held by private institutions.
|
||||
|
||||
Conclusion:
|
||||
|
||||
If the US loses World Reserve Currency status, two things happen. 1) Foreign central banks start massively dumping their [huge Treasury/Dollar debt positions](https://fred.stlouisfed.org/series/BOGZ1FL263061130Q) and 2) SWIFT member banks who hold USDs for cross-border payments (EuroDollars) decide to dump them as they see the writing on the wall and see the value of their assets decreasing by the day. This is the one of the many [Swords of Damocles](https://idioms.thefreedictionary.com/a+sword+of+Damocles+hangs+over+head) hanging over the global financial system. The unraveling of these massive currency positions would truly be catastrophic. Interest rates could effectively jump to +30% or more overnight, creating an immediate solvency crisis for the US Government and most banks, corporations, and state governments who rely on low interest rate borrowing. [DXY](https://en.wikipedia.org/wiki/U.S._Dollar_Index) would be whipsawed violently before being forced downward by massive selling pressure from the Eurodollar market. Other currencies would be pulled higher and then lower in volatile moves matching the worst days of the early Nixon crisis. But, this is only part of the story. We will come back to this later.
|
||||
|
||||
------------------------------------------------------------------------------------------------------------------------------------------------
|
||||
|
||||
Epilogue:
|
||||
|
||||
We've gone over a brief history of the Bretton Woods system, and it's transformation to a complete fiat money system starting in 1971. The US as a World Reserve Currency holder is allowed to borrow almost indefinitely without immediate consequence, but this creates massive amounts of US dollar debts overseas. The last time global creditors started to lose faith in the US dollar, we saw massive inflation, unemployment, and stagnation in the US, in a period of rapid demographic and economic growth in the rest of the world. If creditors become worried again, and signs are showing up that they are (more on this in PT4) the results could be catastrophic.
|
||||
|
||||
BUY, HODL, BUCKLE UP.
|
||||
|
||||
>>>>>>>TO BE CONTINUED >>>>>>> PART TWO
|
||||
|
||||
(Adding this to clear up FUD- My argument is for hyperinflation to begin in a few years- this is a years- long PROCESS, and will take a long time to play out. It won't happen tomorrow, but we are in the same situation as Germany after WW1. Hyperinflation is GOOD FOR GME--- DEBT VALUE COLLAPSES, MONEY CHASES ASSETS (EQUITIES) pushing the price UP, so shorts will have to cover) BUY AND HOLD.
|
||||
|
||||
*Nothing on this Post constitutes investment advice, performance data or any recommendation that any security, portfolio of securities, investment product, transaction or investment strategy is suitable for any specific person. From reading my Post I cannot assess anything about your personal circumstances, your finances, or your goals and objectives, all of which are unique to you, so any opinions or information contained on this Post are just that -- an opinion or information. Please consult a financial professional if you seek advice.*
|
||||
|
||||
*If you would like to learn more, check out my recommended reading list [here](https://docs.google.com/document/d/1nSw9odLoExaq0oEBqIHrCK1Xj5KfyjBkGQZ93LTh34g/edit?usp=sharing)
|
||||
@ -0,0 +1,165 @@
|
||||
The Dollar Endgame PART 2 "The Ouroboros"
|
||||
=========================================
|
||||
|
||||
| Author | Source |
|
||||
| :----: | :----: |
|
||||
| [u/peruvian_bull](https://www.reddit.com/user/peruvian_bull/) | [Reddit](https://www.reddit.com/r/Superstonk/comments/o727oc/the_dollar_endgame_part_2_the_ouroboros/) |
|
||||
|
||||
---
|
||||
|
||||
|
||||
[DD 👨🔬](https://www.reddit.com/r/Superstonk/search?q=flair_name%3A%22DD%20%F0%9F%91%A8%E2%80%8D%F0%9F%94%AC%22&restrict_sr=1)
|
||||
|
||||
Apes, this is a continuation of my Dollar Endgame Series. You can find Part 1 [here](https://www.reddit.com/r/Superstonk/comments/o4vzau/hyperinflation_is_coming_the_dollar_endgame_part/).
|
||||
|
||||
I am getting increasingly worried about the amount of warning signals that are flashing red for hyperinflation- I believe the process has already begun, as I will lay out in this paper. The first stages of hyperinflation begin slowly, and as this is an exponential process, most people will not grasp the true extent of it until it is too late. I know I'm going to gloss over a lot of stuff going over this, sorry about this but I need to fit it all into four posts without giving everyone a 400 page treatise on macro-economics to read. Counter-DDs and opinions welcome. This is going to be a lot longer than a normal DD, but I promise the pay-off is worth it, knowing the history is key to understanding where we are today.
|
||||
|
||||
SERIES (Parts 1-4) TL/DR: We are at the end of a MASSIVE debt supercycle. This 80-100 year pattern *always* ends in one of two scenarios- default/restructuring (deflation a la Great Depression) or inflation (hyperinflation in severe cases (a la Weimar Republic). The United States has been abusing it's privilege as the World Reserve Currency holder to enforce its political and economic hegemony onto the Third World, specifically by creating massive artificial demand for treasuries/US Dollars, allowing the US to borrow extraordinary amounts of money at extremely low rates for decades, creating a [Sword of Damocles](https://idioms.thefreedictionary.com/a+sword+of+Damocles+hangs+over+head) that hangs over the global financial system. The massive debt loads have been transferred worldwide, and sovereigns are starting to call our bluff. Governments papered over the 2008 financial crisis with debt, but never fixed the underlying issues, ensuring that the crisis would return, but with greater ferocity next time. Systemic risk (from derivatives) within the US financial system has built up to the point that collapse is all but inevitable, and the Federal Reserve has demonstrated it will do whatever it takes to defend legacy finance (banks, broker/dealers, etc) and government solvency, even at the expense of everything else (The US Dollar).
|
||||
|
||||
I'll break this down into four parts. ALL of this is interconnected, so please read these in order:
|
||||
|
||||
- [Part One: The Global Monetary System- "A New Rome" ](https://www.reddit.com/r/Superstonk/comments/o4vzau/hyperinflation_is_coming_the_dollar_endgame_part/)<
|
||||
|
||||
- Part Two: Derivatives, Systemic Risk, & Nitroglycerin- "The Ouroboros" < (YOU ARE HERE)
|
||||
|
||||
- Part Three: Banks, Debt Cycles & Avalanches- "The Money Machine" <
|
||||
|
||||
- Part Four: Financial Gravity & the Fed's Dilemma- "At World's End" <
|
||||
|
||||
Preface:
|
||||
|
||||
Some Terms you need to know:
|
||||
|
||||
[Derivatives](https://www.investopedia.com/terms/d/derivative.asp): A derivative is a financial [security](https://www.investopedia.com/terms/s/security.asp) with a value that is reliant upon or derived from, an underlying asset or group of assets---a benchmark. The derivative itself is a contract between two or more parties, and the derivative derives its price from fluctuations in the underlying asset. The most common underlying assets for derivatives are stocks, bonds, commodities, currencies, interest rates, and market indexes.
|
||||
|
||||
[Normalized Curve Distribution](https://www.simplypsychology.org/normal-distribution.html) (Bell Curve): The normal distribution is a continuous probability distribution that is symmetrical on both sides of the mean, so the right side of the center is a mirror image of the left side. The area under the normal distribution curve represents probability and the total area under the curve sums to one. (We'll go over this more in-depth later).
|
||||
|
||||
[Value-At-Risk](https://www.investopedia.com/terms/v/var.asp) (VaR Distribution): Value at risk (VaR) is a statistic that measures and quantifies the level of financial risk within a firm, portfolio or position over a specific time frame. This metric is most commonly used by investment and commercial banks to determine the extent and occurrence ratio of potential losses in their institutional portfolios. Risk managers use VaR to measure and control the level of risk exposure.
|
||||
|
||||
[Rehypothecation](https://www.investopedia.com/terms/r/rehypothecation.asp): Rehypothecation is a practice whereby banks and brokers use, for their own purposes, assets that have been posted as collateral by their clients. Clients who permit rehypothecation of their collateral may be compensated either through a lower cost of borrowing or a rebate on fees.
|
||||
|
||||
[Exchange-Traded (Listed) Derivative](https://www.investopedia.com/terms/e/exchange-traded-derivative.asp): An exchange-traded derivative is merely a derivative contract that derives its value from an underlying asset that is listed on a trading exchange and guaranteed against [default](https://www.investopedia.com/terms/d/default2.asp) through a clearinghouse. Due to their presence on a trading exchange, ETDs differ from over-the-counter derivatives in terms of their standardized nature, higher [liquidity](https://www.investopedia.com/terms/l/liquidity.asp), and ability to be traded on the [secondary market](https://www.investopedia.com/terms/s/secondarymarket.asp).
|
||||
|
||||
[Over the Counter Derivative](https://www.investopedia.com/ask/answers/052815/what-overthecounter-derivative.asp): An over the counter (OTC) derivative is a financial contract that does not trade on an asset exchange, and which can be tailored to each party's needs. Over the counter derivatives are instead private contracts that are negotiated between counterparties without going through an exchange or other type of formal intermediaries, although a broker may help arrange the trade.
|
||||
|
||||
Part Two: Derivatives, Systemic Risk, and Nitroglycerin- "The Ouroboros"
|
||||
|
||||
[](https://preview.redd.it/lscwu54x68771.png?width=626&format=png&auto=webp&s=f9b6ed88c18bc0d71ac368509af350f34644caa0)
|
||||
|
||||
The Ouroboros
|
||||
|
||||
Prologue:
|
||||
|
||||
"The [Ouroboros](https://en.wikipedia.org/wiki/Ouroboros), a Greek word meaning "tail devourer", is the ancient symbol of a snake consuming its own body in perfect symmetry. The imagery of the Ouroboros evokes the concept of the infinite nature of self-destructive feedback loops. The sign appears across cultures and is an important icon in the esoteric tradition of Alchemy. Egyptian mystics first derived the symbol from a real phenomenon in nature. In extreme heat a snake, unable to self-regulate its body temperature, will experience an out-of-control spike in its metabolism.
|
||||
|
||||
In a state of mania, the snake is unable to differentiate its own tail from its prey, and will attack itself, self-cannibalizing until it perishes. In nature and markets, when randomness self-organizes itself into too perfect symmetry, order becomes the source of chaos, and chaos feeds on itself."-
|
||||
|
||||
([Artemis Capital Research Paper](https://artemiscm.docsend.com/view/2b34894bzsaqsbcx)- extra credit reading, but warning, this is ADVANCED finance- you'll pop a lot of wrinkles reading it)
|
||||
|
||||
Random Walks and Portfolio Insurance
|
||||
|
||||
In financial markets, traders have long looked for mathematical relationships between and within assets, to aid in speculation and price prediction. As data aggregation improved, and information became more widely distributed in the 1930s and 1940s, Financial analysts quickly realized that the [stock market as a whole](https://klementoninvesting.substack.com/p/the-distribution-of-stock-market), as well as individual securities, followed [Bell Curve](https://www.simplypsychology.org/normal-distribution.html) Distributions, at least in most time periods.
|
||||
|
||||
The performance of individual securities on a single day was essentially random, but their overall performance in a time period could be graphed, as seen below:
|
||||
|
||||
[](https://preview.redd.it/pakm4imk28771.png?width=646&format=png&auto=webp&s=d9122a8c28e8a204bafeba369c958efdd042467c)
|
||||
|
||||
Bell Curve Distribution fitted to Market Returns
|
||||
|
||||
This flowed logically from the concept of random events that [Brownian motion](http://web.mit.edu/8.334/www/grades/projects/projects17/OscarMickelin/brownian.html) described. In the mid- 1800s, scientist [Robert Brown](https://en.wikipedia.org/wiki/Brownian_motion) saw that particles in a fluid sub-domain bounced around randomly, with their individual movements being essentially unpredictable- these movements were completely random. Drawing on Brownian motion, mathematicians had created [Probability Theory](https://en.wikipedia.org/wiki/Probability_theory), which could estimate the given probability (not certainty) of a set of outcomes.
|
||||
|
||||
As an analogy, predicting the result of an individual coin toss accurately every time is essentially impossible, but if you do it 100 times, Probability theory will tell you that you have a very high probability of 50 heads and 50 tails, or something close to it (45/55 or 53/47 for example).
|
||||
|
||||
The likelihood of 95 heads and 5 tails, an extreme outlier, would be very close to 0. This is because there is a 50% probability of either heads or tails- and thus the distribution of 100 coin flips should roughly match this probability. This theory of randomness of prices as it applied to finance came to be known as the [Random Walk Theory](https://corporatefinanceinstitute.com/resources/knowledge/trading-investing/what-is-the-random-walk-theory/)- and predicted that prices were basically completely unpredictable.
|
||||
|
||||
Understanding this concept, traders in the 1960s observed that the probability was great that returns on a single equity security would hover between some set performance range, like -10% and +10%. Rarely did the return hit the extreme ends of the curve.
|
||||
|
||||
It didn't matter what the time period was, 1 day, 1 month, or 1 year, the traders always had trouble reliably predicting a single future movement (like predicting heads/tails on a single coin toss), but could reliably say what the probability of variance over time (outcome of 100 coin tosses) would be, and map this mathematical distribution on a bell curve.
|
||||
|
||||
These Bell Curve distributions, after being modified for applications in financial markets, came to be known as [Value At Risk](https://www.investopedia.com/terms/v/var.asp) (VaR) models. Over the course of the 1960s and 1970s, these [models](http://people.stern.nyu.edu/adamodar/pdfiles/papers/VAR.pdf) came to be [widely used](http://stat.wharton.upenn.edu/~steele/Courses/434/434Context/RiskManagement/VaRHistlory.pdf) in the asset management industry.
|
||||
|
||||
Essentially what these VaR models could do was provide a statistical technique used to measure the amount of [potential loss](https://corporatefinanceinstitute.com/resources/knowledge/trading-investing/value-at-risk-var/) that could happen in an investment portfolio over a specified period of time. Value at Risk gives the probability of losing more than a given amount in a given portfolio.
|
||||
|
||||
[](https://preview.redd.it/mrqixcou38771.png?width=626&format=png&auto=webp&s=2c452ed7175c8bec851f2e4547e80df68ac31119)
|
||||
|
||||
Value-at-Risk Model
|
||||
|
||||
You can see from the above that these models have "skinny tails", that is to say, they predict the likelihood of extreme events (standard deviation of 3 or more) happening as very low- especially on the downside (see above). Outlier events were thus coined "[tail risk](https://www.investopedia.com/terms/t/tailrisk.asp#:~:text=Tail%20risk%20is%20a%20form,shown%20by%20a%20normal%20distribution.)", occurrences that only show up on the far tails of the distribution. Tail risk events were shown to be SO unlikely that the fund managers basically didn't hedge for them AT ALL.
|
||||
|
||||
These models were built using the recorded historical prices of thousands of commodities, equities, and bonds. For earlier markets, they would even plug in estimates created by econometricians (i.e. Corn prices in 1430) to arrive at a large enough data set.
|
||||
|
||||
With this data, asset managers could feel safe utilizing leverage and complex derivatives in risky investments, as these models told them that the likelihood of severe losses (-30% for example) in a single day was near-zero. (Fundamental rule of math is you CANNOTfor certain predict future outcomes based on past experiences- but they did it anyways...)
|
||||
|
||||
At the same time, [Eugene Fama](https://en.wikipedia.org/wiki/Eugene_Fama), an American economist freshly minted with a PhD from the University of Chicago, developed his [Efficient Markets Hypothesis](https://www.investopedia.com/terms/e/efficientmarkethypothesis.asp) in early 1970. Drawing on the random walk theory, Fama posited that since stock movements were random, it was impossible to "beat the market".
|
||||
|
||||
Current market prices incorporated all available and future information, and thus buying undervalued stocks, or selling at inflated prices, was not feasible. [Making consistent profits was impossible](https://corporatefinanceinstitute.com/resources/knowledge/trading-investing/efficient-markets-hypothesis/)- if you made money, you just got "lucky" as the market randomly moved in your favor after you made the trade. The price, therefore, was always "right".
|
||||
|
||||
[](https://preview.redd.it/ktn8rya048771.png?width=646&format=png&auto=webp&s=5fc831830ca80cc77b339c94874abd26d5932283)
|
||||
|
||||
Efficient Market Hypothesis
|
||||
|
||||
This further emboldened investors and whetted their risk appetite. Armed with these two theories, they started making statistical algorithms that modeled the stock market, and loaded themselves up with more risk. Starting in the early 1980s, [portfolio insurance](https://www.investopedia.com/terms/p/portfolioinsurance.asp) started to gain traction within the industry. This "insurance" basically was an automated system that [short-sold S&P 500 Index futures](https://www.investopedia.com/ask/answers/042115/what-caused-black-monday-stock-market-crash-1987.asp) in case of a market decline.
|
||||
|
||||
This concept was invented by [Hayne Leland](https://en.wikipedia.org/wiki/Hayne_Leland) and Mark Rubinstein, who started a business named Leland O'Brien Rubinstein Associates (LOR) in 1980, and was developed into a computer program commonly referred to by the same acronym. They were successful in marketing this product, and by the mid-1980s, hundreds of millions of dollars of Assets Under Management ([AUM](https://www.investopedia.com/terms/a/aum.asp)) from institutions ranging from investment banks to large mutual funds were protected by this new-fangled product.
|
||||
|
||||
LOR was a program that [dynamically hedged](https://www.glynholton.com/notes/dynamic_hedging/), i.e. would observe market conditions, and understanding it's own portfolio risk, would actively adjust in real time. Today, dynamic hedging is used by derivative dealers to hedge gamma or vega exposures. Because it involves adjusting a hedge as the underlier moves---often several times a day---it is "dynamic."
|
||||
|
||||
The founders of LOR touted it as a program that would actively work to protect a portfolio, a "fire and forget" approach that would allow portfolio managers and traders to focus on [alpha-generation](https://www.investopedia.com/terms/a/alpha.asp) rather than worrying about potential losses.
|
||||
|
||||
Smoothbrain summary:
|
||||
|
||||
- No one can accurately predict the future (ie the outcome of a single coin toss). But, you can predict the probable outcomes of a series of coin-tosses.
|
||||
|
||||
- Using this theory of the probability of outcomes, you can build a bell curve of probabilities of returns. Adapting this to financial markets, it comes to be called the Value-At-Risk model.
|
||||
|
||||
- This Value At Risk model tells you that the likelihood of a severe adverse event happening (large losses in a single day) is very low. Thus you feel safe leveraging your portfolio and buying derivatives.
|
||||
|
||||
- The Efficient Markets Hypothesis tells you that it is near impossible to consistently beat the market. Prices are always "right" and already incorporate all known and knowable information, so fundamental (and technical) analysis is completely useless. Thus the best way to juice returns is to load up on leverage and derivatives.
|
||||
|
||||
- Two experts in the fields of finance and economics create a new product called LOR, which was 'portfolio insurance' that promised to limit downside losses in case of a market collapse. Hundreds of institutions, banks, and hedge funds buy and implement LOR's dynamic hedging into their portfolio. This program short-sold S&P 500 futures in the event of a market decline.
|
||||
|
||||
Black Monday- October 19, 1987
|
||||
|
||||
Stock markets raced upward during the first half of 1987. By late August, the [DJIA](https://en.wikipedia.org/wiki/Dow_Jones_Industrial_Average) (Dow Jones) had gained 44 percent in a matter of seven months, stoking concerns of an asset bubble. In mid-October, a storm cloud of news reports undermined investor confidence and led to additional volatility in markets.
|
||||
|
||||
The federal government disclosed a larger-than-expected trade deficit and the dollar fell in value. The markets began to unravel, foreshadowing the record losses that would develop a week later.
|
||||
|
||||
Beginning on October 14, a number of markets began incurring large daily losses. On October 16, the rolling sell-offs coincided with an event known as "[triple witching](https://www.forex.com/en/market-analysis/latest-research/what-is-triple-witching/)," which describes the circumstances when monthly expirations of options and futures contracts occurred on the same day.
|
||||
|
||||
By the end of the trading day on October 16, which was a Friday, the DJIA had lost 4.6 percent. The weekend trading break offered only a brief reprieve; Treasury Secretary James Baker on Saturday, October 17, publicly threatened to de-value the US dollar in order to narrow the nation's widening trade deficit. Then the unthinkable happened.
|
||||
|
||||
[](https://preview.redd.it/39kpennd48771.png?width=644&format=png&auto=webp&s=05033a945abf9b7cfd4f245e6b2502e048619f40)
|
||||
|
||||
DJIA (Tradingview) - Historical Realized Volatility on the bottom scale
|
||||
|
||||
Even before US markets opened for trading on Monday morning, stock markets in and around Asia began plunging. Additional investors moved to liquidate positions, and the number of sell orders vastly outnumbered willing buyers near previous prices, creating a cascade in stock markets.
|
||||
|
||||
In the most severe case, [New Zealand's stock market fell 60 percent](https://www.nzherald.co.nz/indepth/business/1987-stock-market-crash/), and would take years to recover. Traders reported racing each other to the pits to sell. Author Scott Patterson describes the scene:
|
||||
|
||||
[](https://preview.redd.it/1wcf5o2o48771.png?width=430&format=png&auto=webp&s=cbd254a4bd9fd41753c282d73cb2916af5a5891e)
|
||||
|
||||
The Quants, pg 51
|
||||
|
||||
Traders on the floor of the NYSE reported seeing ticker numbers spinning so fast that they were unreadable. Liquidity vanished completely from the market. Sell orders flooded in so fast the infrastructure to record them started malfunctioning.
|
||||
|
||||
At one point, [specialists](https://www.thebalance.com/what-is-a-market-maker-and-how-do-they-make-money-4053753) (individual market makers, and at this time were people on the floor representing a firm) simply stopped picking up the phone, which was ringing with dozens of institutions begging them to sell.
|
||||
|
||||
Dozens of stocks were frozen in time. Those that weren't were hit with massive volume. At one point, Proctor and Gamble was trading for $0.03. It had ended trading the previous Friday at $6.09. Market makers were trading off the stock prices that were recorded an hour ago, since the infrastructure was so backed up. (Check out [this episode](https://open.spotify.com/episode/7cxASLFFUrWkJaMqpUY3pW?si=plwMAktBRhGggqLbwHx8UQ&dl_branch=1) of RealVision Podcast to learn more. In fact, just go subscribe to their show and start listening from the beginning, they have one of the best finance podcasts out there).
|
||||
|
||||
In the United States, this collapse quickly came to be known as "[Black Monday](https://www.federalreserve.gov/pubs/feds/2007/200713/200713pap.pdf)", with the DJIA [finishing down 508 points, or 22.6 percent](https://www.investopedia.com/terms/s/stock-market-crash-1987.asp). "There is so much psychological togetherness that seems to have worked both on the up side and on the down side," Andrew Grove, Chief Executive of technology company Intel Corp., said in an interview. "It's a little like a theater where someone yells 'Fire!' (and everybody runs for the exit)".
|
||||
|
||||
"It felt really scary," said Thomas Thrall, a senior professional at the Federal Reserve Bank of Chicago, who was then a trader at the Chicago Mercantile Exchange. "People started to understand the interconnectedness of markets around the globe."
|
||||
|
||||
For the first time, investors could watch on live television as a financial crisis spread market to market -- in much the same way [viruses move through human populations and computer networks](https://www.wired.com/story/how-fast-does-a-virus-spread/). ([Source](https://www.federalreservehistory.org/essays/stock-market-crash-of-1987)).
|
||||
|
||||
Black Monday represented a catastrophic rebuttal to the mathematicians and economists who created the Random Walk Theory and Value- At- Risk models. These probability theorists had stated that events like this were improbable- so improbable in fact that their models predicted Black Monday was IMPOSSIBLE. Thus, no one in the market had hedged or expected an event as extreme as this. In fact, some theoreticians started to doubt the validity of the previously iron-clad Efficient Market Hypothesis itself. Patterson continues:
|
||||
|
||||
[](https://preview.redd.it/egil7fww48771.png?width=380&format=png&auto=webp&s=6f5cf4b457207185aec4c4392e87bf118a8bbf90)
|
||||
|
||||
The Quants, pg 53
|
||||
|
||||
Black Monday also represented a fascinating case study in the devastating effects of derivatives on financial markets. The Index Arbitrageurs, buying the S&P 500 futures being sold by portfolio insurance, had raced to short sell the underlying stock to stay net neutral. This was because by owning the S&P 500 futures, they effectively owned a small piece of every stock in the index. To [hedge](https://www.investopedia.com/trading/hedging-beginners-guide/#:~:text=Hedging%20is%20a%20risk%20management,as%20options%20and%20futures%20contracts.), they had to quickly short the underlying, so that any large loss in the index futures they owned would be offset by a gain on a short position in the individual stocks.
|
||||
|
||||
However, the S&P 500 index itself was calculated based on the prices of the underlying securities. Thus, after Portfolio insurance sold the arbs' futures, the Index arbs short sold billions of dollars worth of stock, the S&P future market tanked, and LOR, seeing the massive volatility and downward pressure on the market, sold more and more futures, which caused the Arbs to short more and more stock. This was the unwelcome discovery of a vicious [positive feedback loop](https://biologydictionary.net/positive-feedback/), a "shadow risk" that existed beneath the surface of the market, unbeknownst to the investors who traded in it. The Ouroboros had been awakened. These feedback loops, once initiated, continued until the underlying factors have been diminished or until the agents in the system are self-destroyed.
|
||||
|
||||
[(The second half of this post is linked here)](https://www.reddit.com/r/Superstonk/comments/o72fc1/the_dollar_endgame_part_25_the_ouroboros/)
|
||||
@ -0,0 +1,149 @@
|
||||
The Dollar Endgame PART 2.5 "The Ouroboros"
|
||||
===========================================
|
||||
|
||||
| Author | Source |
|
||||
| :----: | :----: |
|
||||
| [u/peruvian_bull](https://www.reddit.com/user/peruvian_bull/) | [Reddit](https://www.reddit.com/r/Superstonk/comments/o72fc1/the_dollar_endgame_part_25_the_ouroboros/) |
|
||||
|
||||
---
|
||||
|
||||
|
||||
[DD 👨🔬](https://www.reddit.com/r/Superstonk/search?q=flair_name%3A%22DD%20%F0%9F%91%A8%E2%80%8D%F0%9F%94%AC%22&restrict_sr=1)
|
||||
|
||||
Apes, this is the second half of Part 2. [You can find the first half of Part 2 here](https://www.reddit.com/r/Superstonk/comments/o727oc/the_dollar_endgame_part_2_the_ouroboros/).
|
||||
|
||||
Derivatives and the Alchemy of Risk
|
||||
|
||||
Derivatives are financial contracts that derive their value from an underlying security, and have existed for as long as markets have. A [futures contract](https://www.investopedia.com/terms/f/futurescontract.asp), for example, is a legal agreement to buy or sell a particular commodity asset, or security at a predetermined price at a specified time in the future. The buyer of a futures contract is taking on the obligation to buy and receive the underlying asset when the futures contract expires, and the seller of the futures contract is taking on the obligation to deliver the underlying asset at the expiration date. These contracts have been around for millenia, with the earliest recorded contract dated to [1750 BC in Mesopotamia, or modern-day Iraq](https://bebusinessed.com/history/history-futures-trading/#:~:text=Futures%20trading%20can%20be%20traced,the%20sixth%20Babylonian%20king%2C%20Hammurabi.&text=Part%20of%20that%20Code%20stipulated,price%20at%20a%20future%20date.).
|
||||
|
||||
Say you're in a casino and you want to make money off a poker game, but you are barred from playing the actual game. So, you grab another patron (Dave) and tell him you'd like to make a bet on the outcome of the game. You really think your friend Allie will win the game, so you're willing to pony up $100 to bet on her winning. (In this example, the bet you make is the "derivative". The underlying security's returns are the results of the poker game.)
|
||||
|
||||
Seeing your derivative bet, two other people get interested. They don't want to bet on the game, rather they want to gamble on the outcome of your bet. They create their own bet, weighing probabilities and putting in funds accordingly. This is a second-order derivative. In the modern financial system, since derivatives are basically unregulated due to the [Commodities Futures Modernization Act](https://www.investopedia.com/terms/c/cfma.asp), (especially OTC derivatives or second-order or higher) this process can continue ad infinitum.
|
||||
|
||||
[](https://preview.redd.it/odmcqfd678771.png?width=615&format=png&auto=webp&s=c802a93608266848687f3444fbd9d4c9a80c3bbe)
|
||||
|
||||
Derivative Bets
|
||||
|
||||
In doing so, the "derivative" gamblers are essentially creating leverage on the poker game. What financial institutions do with derivatives is create these bets (Derivative^2 for example) and then sell these bets to others. This is an IMMENSELY profitable business for them.
|
||||
|
||||
When creating a portfolio, most investors worry about their loss exposure. Buying any single equity is risky, and it is reasonable to want to reduce downside risk. This is part of the reason why derivatives were created. Through [hedging](https://www.investopedia.com/trading/hedging-beginners-guide/#:~:text=Hedging%20is%20a%20risk%20management,as%20options%20and%20futures%20contracts.), traders were able to change their gross exposure into a [net exposure](https://corporatefinanceinstitute.com/resources/knowledge/trading-investing/net-exposure/). Net exposure underlines the difference (net amount) between a hedge fund's long positions and its short stock or derivative positions. Once calculated, the net exposure of a fund is usually presented in a percentage, displaying the fund's risk with regard to market fluctuations.
|
||||
|
||||
Let's break it down. Say you are bullish on IBM. You go out and buy $50M of long dated [call options](https://www.investopedia.com/terms/c/calloption.asp) (commonly called [LEAPS](https://www.investopedia.com/terms/l/leaps.asp)) on IBM. Since you're afraid of losing money in case IBM misses it's earnings call, loses revenue, or experiences some other negative event while your position is open, you go and buy $40M of [put options ](https://www.investopedia.com/terms/p/putoption.asp)with the same expiry date. Thus, your new Net exposure position is only $10M long.
|
||||
|
||||
[](https://preview.redd.it/ope41no978771.png?width=642&format=png&auto=webp&s=2136a19ecc25ea5fa0bff0ec5d90e7ff2a95d96d)
|
||||
|
||||
Net Exposure Hedging
|
||||
|
||||
Using this mechanism, traders were able to hedge positions and reduce their theoretical risk. When you buy calls and puts, this net exposure is reduced, and at the same time, your assets increase. In the example above, your gross exposure (the gross value of the derivatives you own) will increase as you own both long calls and long puts. (Don't get this confused with being long/short or bullish/bearish a stock!! Long position for derivatives simply means YOU OWN the contract, short position means YOU OWE the contract. "Long/Short" is a general term in finance that can mean different things depending on the context!! [Read this if you're confused](https://www.investopedia.com/terms/l/long.asp))
|
||||
|
||||
Since both these calls and puts have value that you paid for, and represent the right to exercise at strike, they are both recorded as assets on your Balance Sheet. In the example above, you OWN $50M of calls and $40M of puts- your overall derivative gross exposure is $90M. Your net exposure is only $10M. Thus you have $90M of assets (subject to market changes of course) and "net risk" of $10M. This is why Shitadel has buttloads of options on either side of every stock, they're hedging their net exposure, even when they're bullish on the underlying.
|
||||
|
||||
There's three interrelated ways this goes seriously wrong. One is counterparty risk. A [counterparty](https://financial-dictionary.thefreedictionary.com/Counterparty) is someone who takes the opposite side of your trade- so if you are buying, they are the seller, and vice-versa. ([I wrote this DD on counterparties and clearinghouses a while ago](https://www.reddit.com/r/Superstonk/comments/nje7xk/clearinghouses_explained/)) In derivatives, if the counterparty to your trade fails, i.e. goes bankrupt, the contract will most likely not be honored. This means if you are a hedge fund, and you wrote OTC options (NOT Exchange traded-please refer to the beginning for the difference between OTC and exchange traded options, exchanged traded options are guaranteed and cleared by OCC (Options section of DTC), OTC options are NOT guaranteed, and can only be written between institutions) your $90M of calls and puts, if they were written with a single counterparty (like Bear Stearns) will now be worth NOTHING. This $90M "gross exposure" loss would represent an 800% HIGHER LOSS than the "theoretical" maximum loss of $10M which is your "Net Exposure". If an options clearinghouse which is the counterparty to all listed options fails, MILLIONS of contracts would be worthless. The TRUE RISK is counterparty risk- this is what the models don't understand.
|
||||
|
||||
Another way this goes wrong is if the underlying fails- the results are equally catastrophic. Going back to the poker game analogy, imagine if the people playing the actual poker game left the table. Now Derivative Bet #1 is worthless, since there's nothing to bet on. Same goes with Derivative bet #2, and #3, and so on. If the Poker game had $25 in the pot, and each Derivative bet had $100 in each bet, this means that by the poker game ending, $325 worth of value was destroyed, from the elimination of just ONE REAL game worth $25. THIS is the explosive nature of derivatives.
|
||||
|
||||
[](https://preview.redd.it/1i8vm7jd78771.png?width=406&format=png&auto=webp&s=08eb280d305046c39e23e456d1b25e392df179c9)
|
||||
|
||||
Synthetic CDO Visualized
|
||||
|
||||
Let's use the 2008 financial crisis as an example of an underlying failure. (W Homeowner goes out and gets a loan (original poker game). The bank then sells that loan to an investment bank who makes a CDO out of it (a bet on the game) which trades on the value of the underlying. Then, another bank comes along and makes a [synthetic CDO](https://en.wikipedia.org/wiki/Synthetic_CDO) (a bet on the bet), and then takes out a Credit Default Swap on it (bet on a bet on a bet). This creates insane leverage to the underlying, and horribly dangerous results if the underlying collapses. Our beloved Dr. Trimbath puts it like this: ([Naked, Short and Greedy](https://www.goodreads.com/book/show/49089890-naked-short-and-greedy?from_search=true&from_srp=true&qid=SnVODNfAhP&rank=1) (Ch 19))
|
||||
|
||||
[](https://preview.redd.it/5k5nddvi78771.png?width=379&format=png&auto=webp&s=7c257e43b6a4f9d5b9772753abcc3571c0f56ae2)
|
||||
|
||||
Naked, Short and Greedy pg 221
|
||||
|
||||
A third way this system can blow up is due to cross-collateralization, where one asset is pledged to multiple entities, creating more claims than assets that exist. This process is actually very common in the futures markets- bullion banks, for example, which hold gold and silver, will write between 2-10 futures contracts for every one oz of gold in the vaults.
|
||||
|
||||
[](https://preview.redd.it/l2musmvn78771.png?width=628&format=png&auto=webp&s=ea4697ebe3169000852eeb48a83c024c16fcf756)
|
||||
|
||||
One Asset pledged to multiple parties
|
||||
|
||||
In the example above, the bullion bank (with the gold) writes 6 futures contracts (assume 1 oz per contract) and sells them to other financial institutions, but only has a single ounce of gold in the vault. They can do this since the vast majority of the futures (~85-90%) [never get called](https://www.sciencedirect.com/science/article/abs/pii/S0927539804000842) in for [settlement](http://www.iotafinance.com/en/Financial-Definition-settlement.html), and are instead [rolled forward](https://www.investopedia.com/terms/r/rollforward.asp) (this basically means when the old contract is about to expire, the holder sells it for cash, and then uses this money to buy a new futures contract with a different expiration date).
|
||||
|
||||
Thus, the bank/institution writing all these futures never has to actually deliver the underlying- the gold in this case. If all the futures contracts they write are called in at once, then the 1 oz of gold is given to the buyer, and the bank who wrote the contract is on the hook to deliver all 5 oz to the firms that are owed, and is forced to go into the market to purchase it- this is called a "Contract Delivery Squeeze" as [outlined in this paper](https://static1.squarespace.com/static/555266c0e4b008b6a4552c3a/t/55626e5ae4b004a8dfc8288d/1432514138731/Gilt_Squeeze_final.pdf). If the bullion bank fails, all the futures written by it are now null and void, and the firms that weren't able to take delivery get nothing.
|
||||
|
||||
(Side note: [Notional Value Explained](https://www.investopedia.com/terms/n/notionalvalue.asp): Notional value is a term often used to value the underlying asset in a derivatives trade. It can be the total value of a position, how much value a position controls, or an agreed-upon amount in a contract-
|
||||
|
||||
The best explanation I've seen of this was on a recent post by [u/Criand--](https://www.reddit.com/u/Criand--/) ALL credit to him/her:
|
||||
|
||||
------------------------------------------------------------------------------------------------------------------------------
|
||||
|
||||
The Market Value is the value of the derivative at its current trading price.
|
||||
|
||||
The Notional Value is the value of the derivative if it was at its strike price.
|
||||
|
||||
E.g. A CALL Option represents 100 shares of ABC stock with a strike of $50. Perhaps it is trading in the market at $1 per contract right now.
|
||||
|
||||
- Market Value= 100 shares * $1 per contract = $100
|
||||
|
||||
- Notional Value= 100 shares* $50 strike price= $5,000
|
||||
|
||||
------------------------------------------------------------------------------------------------------------------------------
|
||||
|
||||
Nitroglycerin
|
||||
|
||||
Imagine you go to the office one day, and see your boss (Anna) sitting there with a bottle of [nitroglycerin](https://pubchem.ncbi.nlm.nih.gov/compound/Nitroglycerin). You are immediately shocked, and ask Anna what she's doing. "Are you INSANE?" you say. "That is extremely dangerous!". She smiles at you and says "Nitroglycerin is stable if not exposed to pressure or heat. It's safe on my desk, as long as I don't knock it off, it won't explode". Incredulous, you walk away. The next day she brings in another bottle. And another the day after that. Over a year, she brings in hundreds of bottles of nitroglycerin. One day, a poor intern trips on her shoes and knocks one down. The first bottle explodes- Boom. In a few milliseconds, the next one does, and the next, in a vicious chain reaction- BOOM! BOOOM! BOOOOOM!. The entire building is destroyed. THIS is the danger of derivatives.
|
||||
|
||||
Systemic Risk
|
||||
|
||||
The recent [Archegos Capital](https://www.wsj.com/articles/what-is-a-total-return-swap-and-how-did-archegos-capital-use-it-11617125839) debacle was a classic example of the destructive power of derivatives. Using contracts like [Total Return Swaps](https://www.investopedia.com/terms/t/totalreturnswap.asp), Bill Hwang was able to leverage his fund [more than 8x](https://www.bloomberg.com/news/articles/2021-05-06/archegos-fallout-crimps-hedge-fund-leverage-as-banks-curb-risks), making bets on the performance of a variety of Chinese and American equities. When the equities lost value, his fund was obliterated- a mere 12.5% drop in the underlying resulted in a complete loss of capital. But, his fund wasn't the only firm affected- Credit Suisse was his counterparty, and thus lost more than [$5.5 Billion, and counting.](https://www.wsj.com/articles/credit-suisses-5-5-billion-archegos-hit-enters-big-league-of-bank-losses-11619256601) If derivatives are an explosive bottle, counterparty risk is a fuse- one that always runs to another bottle of Nitroglycerin.
|
||||
|
||||
The modern financial system is effectively a complex network of institutions, tied to each other through these complex derivative contracts. [GSIBs](https://www.fsb.org/2020/11/2020-list-of-global-systemically-important-banks-g-sibs/) (Globally Systemic Important Banks) are the largest entities in the system, tied directly to thousands of institutions, and indirectly to hundreds of thousands. Here's a fascinating map from an [IMF White Paper on the GSIBs' interconnectedness:](https://www.imf.org/~/media/Files/Publications/WP/2017/wp17210.ashx)
|
||||
|
||||
[](https://preview.redd.it/wyuqw4lx78771.png?width=546&format=png&auto=webp&s=dfa4c60bb2948d77953ac7c000b5080997d70194)
|
||||
|
||||
IMF White Paper, 2016. (See legend for details)
|
||||
|
||||
The entire derivatives market is HUGE. The BIS estimated the total notional value of the [OTC derivatives market](https://www.bis.org/publ/otc_hy1911.htm) to be $640 Trillion in 2019! And that doesn't even include exchange-listed derivatives like most common option contracts. More sober estimates put it somewhere north of $1 Quadrillion. [Visual Capitalist has a great graph that demonstrates the monstrosity of this number. ](https://www.visualcapitalist.com/all-of-the-worlds-money-and-markets-in-one-visualization-2020/)Numbers of this size are hard to wrap your head around- this is equivalent to a million billion, or a thousand trillion- for reference, the US economy is around [$22 Trillion](https://www.thebalance.com/us-economy-facts-4067797) and the world economy is estimated to be [$88 Trillion](https://www.visualcapitalist.com/the-88-trillion-world-economy-in-one-chart/)- thus the entire world economy could fit into the notional derivatives market 11x over and STILL not reach it. Every single bank is exposed, either directly or indirectly, to this market. For example, [Deutsche Bank ALONE has over $47 Trillion in Notional gross exposure](https://www.wsj.com/articles/does-deutsche-bank-have-a-47-trillion-derivatives-problem-1475689629)- TWICE the size of the entire US Economy!
|
||||
|
||||
Through the magic of financial engineering, Deutsche is able to create a net exposure of only [$22 Billion](https://www.marketwatch.com/story/deutsche-bank-pegs-its-derivatives-exposure-at-about-22-billion-and-faces-challenges-in-shedding-those-assets-2019-07-26), equivalent to 0.046% of the notional. Thus, although on paper its risk is extremely small, the actual risk to the firm is enough to wipe it out basically overnight. This is what happened to institutions like [AIG in the 2008 crisis](https://insight.kellogg.northwestern.edu/article/what-went-wrong-at-aig) - they insured more products than they could ever cover, and when the firms they insured came calling they were quickly forced into bankruptcy, requiring a [$182 Billion bailout from the Federal Reserve](https://www.thebalance.com/aig-bailout-cost-timeline-bonuses-causes-effects-3305693).
|
||||
|
||||
If the hedge funds with derivatives exposure (like Archegos) are the equivalent of an office rigged with nitroglycerin, the banks are stadiums full of 50 gallons drums of this shit- and the DTCC/ICC/OCC are the equivalent of a nuke. Counterparty risk, in the form of fuses, runs between all of them. What happens when enough factors on the system start to apply too much pressure? BOOM.
|
||||
|
||||
[](https://preview.redd.it/5v1y6jl288771.png?width=619&format=png&auto=webp&s=5f5d79be62330c3b5d940e8291e5f09e8098df44)
|
||||
|
||||
Los Alamos Testing Grounds, Nuclear Bomb
|
||||
|
||||
Why hasn't anything happened?
|
||||
|
||||
This is the question most people ask themselves when they first learn about this. The reason is actually very simple. As long as money keeps flowing into the Casino, the gamblers feel little risk, so no one pulls out. The Fed continues to print money, equity/bond prices continue to rise, and since there's "no risk" of the underlying falling in value, everyone keeps their money in the pot, and the poker game continues.
|
||||
|
||||
The profits made from derivatives trading are enormous, and any bank that stopped doing this would quickly lose investors, because they would instantly take their capital out and take it to another bank that actually is profitable. It's all a confidence game- as long as everyone is confident, prices keep rising, and the cash keeps pumping in, the party will continue.
|
||||
|
||||
Warren Buffet famously turned down calls to buy Lehman Brothers during the darkest days of the Financial Crisis- he understood a key concept, that derivatives (especially when they make up the majority of your fund (hey Kenny :) ) are equivalent to Financial [Weapons of Mass Destruction](https://www.prospectmagazine.co.uk/economics-and-finance/financial-weapons-of-mass-destruction-brexit-and-the-looming-derivatives-threat), able to destroy entire firms, and indeed entire systems, in one fell swoop.
|
||||
|
||||
[](https://preview.redd.it/7w246k8788771.png?width=520&format=png&auto=webp&s=eb53cda3ac21b700914e06661121670f92e2a858)
|
||||
|
||||
Quote from Berkshire Hathaway Shareholder Letter, 2002
|
||||
|
||||
In the tumultuous month of October 2008, this system was beginning to unravel. The money draining out of the financial system due to bank runs and frozen credit lending started to light fires in multiple financial institutions. The bombs that were Bear Sterns, AIG and Lehman had already blown up, and the fire was spreading through counterparty risk throughout the system. In fact, we were getting dangerously close to hitting the switch on the nuclear warhead- As Timothy Geitner (Pres of New York Fed) put it, "[We were a few days away from the ATMs not working](https://www.youtube.com/watch?v=QozGSS7QY_U)" (start video at 46:07). (Seriously, go watch this documentary. Its fucking AMAZING).
|
||||
|
||||
And the worst part of all of this? Even to this day, Regulators, and indeed even financial industry insiders, are completely blind to the risk. OTC Derivatives are essentially unregulated- NO ONE knows the true size of this market. Worse yet, the traders inside the bank are using optimistic versions of the Efficient Market Hypothesis and VaR models to estimate their risk, which comes out to essentially 0 due to the risk models and net exposure hedging. Thus, they pile on more risk every day, ensuring that this problem continues to grow-- until the entire system explodes.
|
||||
|
||||
Smoothbrain Overview:
|
||||
|
||||
- Analysts noticed statistical patterns in stocks. Small moves (1%) were much more common than large moves (20%). They created models called Value-at Risk, which predicted extreme losses were not just unlikely, they were virtually IMPOSSIBLE. Thus Fund managers feel more confident, and gamble on riskier and riskier investments. The Financial Services Industry STILL uses these VaR models today.
|
||||
|
||||
- Eugene Fama creates the Efficient Market Hypothesis. Since prices are "random" they are unpredictable- and also always "right". Thus there is no way to beat the market, the best thing one can do is leverage up and ride the market up.
|
||||
|
||||
- Certain market dynamics like index arbitrage, counterparty risk, and shorting (both legit and naked) create positive feedback loops, processes that feed on themselves EXPONENTIALLY ('The Ouroboros') to the upside or downside. These processes can lead to extreme dislocations in price movement, like a short squeeze (GME) or a rapid equity market collapse (Black Monday).
|
||||
|
||||
- Derivatives are created with the goal of reducing risk, and they do, to a certain extent, but they also amplify risk- and create potential losses multiples greater than what the fund managers expected.
|
||||
|
||||
- Through hedging, traders believe they reduce net exposure and thus overall firm risk. After hedging, they feel safe buying exotic financial products and leveraging the firm even more. They believe that their ONLY RISK is Net Exposure- but the TRUE RISK is Gross expsoure- They essentially are BLIND to the real exposure of the firm.
|
||||
|
||||
- The entire financial system is filled to the brim with derivatives- everyone is exposed. The total notional market is estimated to be somewhere around $1 Quadrillion, with some estimates putting it even higher. This represents what Buffet called "[A Time Bomb](https://www.investopedia.com/terms/d/derivativestimebomb.asp)" in the market- as long as money flows in, the party continues. Once it stops, the Weapons of Financial Destruction are unleashed.
|
||||
|
||||
Conclusion:
|
||||
|
||||
The modern international financial system, unhinged from the fetters of regulation and oversight, has created a derivatives monster whose tendrils reach across the globe. Fed by the incessant money printer and holding the retirement funds of generations, this machine continues to bet, in ever-increasing amounts, in the greatest casino ever created. This monster, as long as it is nourished by cheap credit and ever increasing flows of cash from the Federal Reserve, will continue to grow. This is part of the reason why I believe the Fed is in the endgame- they KNOW that they cannot turn off the liquidity hose, as they would risk destroying the system in its entirety. They have to convince themselves and the market with constant assurances that inflation will remain low, risk is non-existent, and their balance sheet can continue to grow without consequence. Secretly, just like Citadel and Melvin, they are starting to realize they are in a burning building with no way out.
|
||||
|
||||
BUY, HODL, BUCKLE UP.
|
||||
|
||||
>>>>>>>TO BE CONTINUED >>>>>>> PART THREE "THE MONEY MACHINE"
|
||||
|
||||
(Adding this to clear up FUD- My argument is for hyperinflation to begin in a few years- this is a years- long PROCESS, and will take a long time to play out. It won't happen tomorrow, but we are in the same situation as Germany after WW1. Hyperinflation is GOOD FOR GME--- DEBT VALUE COLLAPSES, MONEY CHASES ASSETS (EQUITIES) pushing the price UP, so shorts will have to cover) BUY AND HOLD.
|
||||
|
||||
*Nothing on this Post constitutes investment advice, performance data or any recommendation that any security, portfolio of securities, investment product, transaction or investment strategy is suitable for any specific person. From reading my Post I cannot assess anything about your personal circumstances, your finances, or your goals and objectives, all of which are unique to you, so any opinions or information contained on this Post are just that -- an opinion or information. Please consult a financial professional if you seek advice.*
|
||||
|
||||
*If you would like to learn more, check out my recommended reading list [here](https://docs.google.com/document/d/1nSw9odLoExaq0oEBqIHrCK1Xj5KfyjBkGQZ93LTh34g/edit?usp=sharing). This is a dummy google account, so feel free to share with friends- none of my personal information is attached. You can also check out a Google docs version of my[ Endgame Series here](https://docs.google.com/document/d/1552Gu7F2cJV5Bgw93ZGgCONXeenPdjKBbhbUs6shg6s/edit?usp=sharing).
|
||||
@ -0,0 +1,169 @@
|
||||
Hyperinflation Is Coming- The Dollar Endgame PART 3 - "The Money Machine"
|
||||
=========================================================================
|
||||
|
||||
| Author | Source |
|
||||
| :----: | :----: |
|
||||
| [u/peruvian_bull](https://www.reddit.com/user/peruvian_bull/) | [Reddit](https://www.reddit.com/r/Superstonk/comments/ogzoco/hyperinflation_is_coming_the_dollar_endgame_part/) |
|
||||
|
||||
---
|
||||
|
||||
|
||||
[DD 👨🔬](https://www.reddit.com/r/Superstonk/search?q=flair_name%3A%22DD%20%F0%9F%91%A8%E2%80%8D%F0%9F%94%AC%22&restrict_sr=1)
|
||||
|
||||
I am getting increasingly worried about the amount of warning signals that are flashing red for hyperinflation- I believe the process has already begun, as I will lay out in this paper. The first stages of hyperinflation begin slowly, and as this is an exponential process, most people will not grasp the true extent of it until it is too late. I know I'm going to gloss over a lot of stuff going over this, sorry about this but I need to fit it all into four posts without giving everyone a 400 page treatise on macro-economics to read. Counter-DDs and opinions welcome. This is going to be a lot longer than a normal DD, but I promise the pay-off is worth it, knowing the history is key to understanding where we are today.
|
||||
|
||||
SERIES (Parts 1-4) TL/DR: We are at the end of a MASSIVE debt supercycle. This 80-100 year pattern *always* ends in one of two scenarios- default/restructuring (deflation a la Great Depression) or inflation (hyperinflation in severe cases (a la Weimar Republic). The United States has been abusing it's privilege as the World Reserve Currency holder to enforce its political and economic hegemony onto the Third World, specifically by creating massive artificial demand for treasuries/US Dollars, allowing the US to borrow extraordinary amounts of money at extremely low rates for decades, creating a [Sword of Damocles](https://idioms.thefreedictionary.com/a+sword+of+Damocles+hangs+over+head) that hangs over the global financial system.
|
||||
|
||||
The massive debt loads have been transferred worldwide, and sovereigns are starting to call our bluff. Governments papered over the 2008 financial crisis with debt, but never fixed the underlying issues, ensuring that the crisis would return, but with greater ferocity next time. Systemic risk (from derivatives) within the US financial system has built up to the point that collapse is all but inevitable, and the Federal Reserve has demonstrated it will do whatever it takes to defend legacy finance (banks, broker/dealers, etc) and government solvency, even at the expense of everything else (The US Dollar).
|
||||
|
||||
I'll break this down into four parts. ALL of this is interconnected, so please read these in order:
|
||||
|
||||
[Part One: The Global Monetary System- "A New Rome" <](https://www.reddit.com/r/Superstonk/comments/o4vzau/hyperinflation_is_coming_the_dollar_endgame_part/)
|
||||
|
||||
[Part Two: Derivatives, Systemic Risk, & Nitroglycerin- "The Ouroboros" <](https://www.reddit.com/r/Superstonk/comments/o727oc/the_dollar_endgame_part_2_the_ouroboros/)
|
||||
|
||||
Part Three: Banks, Debt Cycles & Avalanches- "The Money Machine" < (YOU ARE HERE)
|
||||
|
||||
Part Four: Financial Gravity & the Fed's Dilemma- "At World's End" <
|
||||
|
||||
(side note: Part 2 *mysteriously* disappeared TWICE and thus got low visibility -- if you missed it please go back and read before continuing!)
|
||||
|
||||
Preface:
|
||||
|
||||
[Fractional Reserve Banking:](https://www.investopedia.com/terms/f/fractionalreservebanking.asp) Fractional reserve banking is a system in which only a fraction of [bank deposits](https://www.investopedia.com/terms/b/bank-deposits.asp) are backed by actual cash on hand and available for withdrawal. This is done to theoretically expand the economy by freeing capital for lending.
|
||||
|
||||
[Debt/Credit Cycles: ](https://www.investopedia.com/terms/c/credit-cycle.asp)A credit cycle describes the phases of access to credit by borrowers. Credit cycles first go through periods in which funds are relatively easy to borrow; these periods are characterized by lower interest rates, lowered lending requirements, and an increase in the amount of available credit, which stimulates a general expansion of economic activity. These periods are followed by a [contraction](https://www.investopedia.com/terms/c/contraction.asp) in the availability of funds.
|
||||
|
||||
[Quantitative Easing (QE)](https://www.investopedia.com/terms/q/quantitative-easing.asp): Quantitative easing (QE) is a form of unconventional [monetary policy](https://www.investopedia.com/terms/m/monetarypolicy.asp) in which a central bank purchases longer-term [securities](https://www.investopedia.com/terms/s/security.asp) from the open market in order to increase the money supply and encourage lending and investment. Buying these securities adds new money to the economy, and also serves to lower interest rates by bidding up fixed-income securities. It also expands the central bank's balance sheet.
|
||||
|
||||
[Quantitative Tightening (QT):](https://www.investopedia.com/terms/t/tightmonetarypolicy.asp) This is the inverse of QE- The central bank tightens policy by raising short-term interest rates. Boosting interest rates increases the cost of borrowing and effectively reduces its attractiveness. Tight monetary policy can be implemented via selling assets on the central bank's balance sheet to the market through [open market operations](https://www.investopedia.com/terms/o/openmarketoperations.asp) (OMO).
|
||||
|
||||
[Bank Reserves: ](https://www.investopedia.com/terms/b/bank-reserve.asp)Bank reserves are the cash minimums that financial institutions must have on hand in order to meet [central bank](https://www.investopedia.com/terms/c/centralbank.asp) requirements. This is real money that must be kept by the bank in a vault on-site or held in its account at the central bank. Cash reserves requirements are intended to ensure that every bank can meet any large and unexpected demand for withdrawals.
|
||||
|
||||
Prologue:
|
||||
|
||||
[](https://preview.redd.it/4f6leb97u7a71.png?width=621&format=png&auto=webp&s=1510c2e35a7ddb551b91f773b534454eb04f0862)
|
||||
|
||||
The Impossible Object
|
||||
|
||||
"The global financial markets walk on the razor's edge between empiricism and what you see is not what you think. The Impossible Object in art is an illustration that highlights the limitations of human perception and is an appropriate construct for our modern capitalist dystopia. The fundamental characteristic of the impossible object is uncertainty of perception. Is it feasible for a real waterfall to flow into itself; or a triangle to twist itself in both directions? Modern financial markets are a game of impossible objects.
|
||||
|
||||
In a world where global central banks manipulate the cost of risk, the mechanics of price discovery have disengaged from reality resulting in paradoxical expressions of value that should not exist according to efficient market theory. Fear and safety are now interchangeable in a speculative and high stakes game of perception. What you see is not what exists, and what exists cannot be understood" - ([Artemis Capital](https://artemiscm.docsend.com/view/74nw2t766wnvnuwj))
|
||||
|
||||
Banking and Debt Cycles
|
||||
|
||||
The modern banking system can trace its [origins to the early days of the Renaissance](https://www.jstor.org/stable/2589849), in Northern Italy. There, in affluent trading cities such as Florence, Venice, and Genoa, traders dealing solely in finance set up benches (called bancas in Italian- where the modern word bank comes from) financing voyages, engaging in arbitrage, and funding ship-building for merchants.
|
||||
|
||||
[Banks of that period](https://www.cobdencentre.org/2016/10/a-history-of-fractional-reserve-banking-or-why-interest-rates-are-the-most-important-influence-on-stock-market-valuations-part-1/) dealt almost exclusively in gold and silver coins, and traded these coins freely for foreign coins stamped by a different King. They quickly realized that dealing in physical coins was costly, burdensome, and dangerous, as thieves would often rob money-laden wagons between towns.
|
||||
|
||||
So, they came up with an innovative solution. Instead of handing over coins to their customers, they would ask that the customer place their gold or silver in the bank's vault, which already stored the bank's own money, and in return the bank would hand them a banknote, or a physical receipt of ownership of the gold. The customer could then take this note and pay for real goods or services someplace else instead of carrying the coins.
|
||||
|
||||
[](https://preview.redd.it/7m6dwadbu7a71.png?width=540&format=png&auto=webp&s=2ff1bce0f82affd05fb25afe13cd3905fc3d716d)
|
||||
|
||||
Early Venetian Banks
|
||||
|
||||
[The banks quickly saw a loophole](https://www.mercatus.org/publications/monetary-policy/fractional-reserve-banking)- no one was auditing their vaults, and comparing how much gold was there versus how many notes the bank had issued. The financiers immediately began to issue more notes than gold in the vault. This system would work fine as long as every customer had confidence in their banknote and believed that the gold backing their coins was actually there.
|
||||
|
||||
But, once the bank started facing financial troubles, and customers showed up to redeem their notes for gold, a bank run would immediately begin- with many clients ending up with worthless pieces of paper after the vaults were emptied. Authorities created extreme punishments for bankers caught issuing more notes than gold in the vault - in some places in Medieval Italy, death penalties were enforced for bankers caught issuing too many notes- in others, life in prison was the punishment.
|
||||
|
||||
Our modern financial system is based on the early Italian antecedents. Most people believe that when you deposit funds into the bank, the money stays in your account. In reality, the funds you invest are immediately lent out, re-deposited, and lent out again. This is called [Fractional Reserve Banking](https://www.investopedia.com/terms/f/fractionalreservebanking.asp#:~:text=Fractional%20reserve%20banking%20is%20a,by%20freeing%20capital%20for%20lending.). Thus, the "money" you see in your bank account is a lie. It isn't really there.
|
||||
|
||||
Let's break down how this works. Say you earn $1000 from a recent paycheck. You go to your bank and deposit these funds. The next day, the bank takes $900 (90%) of the cash you deposited and loans it out, keeping 10% in reserve in case you come to withdraw some of it.
|
||||
|
||||
This money is given to Person #1, who takes this loan and buys some paint for his house. The vendor who sold him the paint then takes the $900 received and deposits it in the bank. The bank then repeats the process, loaning out 90% of the money, or $810 to Person #3, who spends/invests it with Person #4, who deposits it again, and the process repeats. Here it is visualized:
|
||||
|
||||
[](https://preview.redd.it/mg5mvzdgu7a71.png?width=621&format=png&auto=webp&s=c4b38b5cc8349a22b39f6e038de906b4aeb0be11)
|
||||
|
||||
Fractional Reserve Banking
|
||||
|
||||
All along the way, the bank is able to take the same dollar bills and re-loan it out through multiple transactions (a la rehypothecation), and charge interest on the loans it creates. This is essentially a near- infinite money glitch in the system, and allows banks to make exorbitant profits, like [JP Morgan making over $12B in Q4 2020 alone](https://www.jpmorganchase.com/content/dam/jpmc/jpmorgan-chase-and-co/investor-relations/documents/quarterly-earnings/2020/4th-quarter/276305ed-730d-4acc-887c-1671d6c39e53.pdf). However, this process also serves to GREATLY increase systemic risk- in the example above, one single $1000 transaction is turned into what APPEARS as $3,439 in bank accounts, but is actually just credit, re-deposited and re-borrowed over and over again.
|
||||
|
||||
[Here's another way to visualize it](https://capturethemind.wordpress.com/2015/07/18/fractional-reserve-banking-one-of-the-biggest-frauds-of-man-kind/):
|
||||
|
||||
[](https://preview.redd.it/vbzys1iju7a71.png?width=616&format=png&auto=webp&s=6f9031fd218bb645ec619fbb3442588d8e06338b)
|
||||
|
||||
Money Rehypothecation
|
||||
|
||||
Typically, the majority of a banks' capital provided to businesses will be business loans, lines of credit, or venture financing. These business loans will be put to work to expand factories, build new products, hire workers, or create intellectual property- generally things that expand economic growth.
|
||||
|
||||
[](https://preview.redd.it/ogqr9ubnu7a71.png?width=618&format=png&auto=webp&s=61c1dfb9e988f1ac18da86c367f1fb4906f7757e)
|
||||
|
||||
Most of the money exists as debt
|
||||
|
||||
This effectively means that the vast majority of what we "think" of as money,[ is not cash, but credit.](https://getmoneyrich.com/economy-and-short-term-debt-cycles/) Most funds in the system, thus, exist in the form of debt.
|
||||
|
||||
Another effect of Fractional Reserve banking is a supercharging of the debt cycle. Because banks are allowed to loan and re-loan cash that is deposited, banks are able to create massive amounts of credit, helping to boost economic growth in the boom stage, and worsen economic decline in a bust.
|
||||
|
||||
The Debt Cycle is a economic phenomenon that has been observed for centuries- [in ancient Israel,](https://digitalcommons.csbsju.edu/cgi/viewcontent.cgi?article=1033&context=obsculta) for example, the state enforced a debt "jubilee" every fifty years (a long human lifespan) to dissolve all debts, release people from bondage, and restore ancestral lands to the descendants.
|
||||
|
||||
There are two main cycles- the long term "super" cycle, which lasts between 50-80 years (longer in countries with higher life expectancy, so most developed countries this is 80 years) and the short term "normal" cycle, which occurs every 8-10 years or so.
|
||||
|
||||
[](https://preview.redd.it/hz3efxltu7a71.png?width=554&format=png&auto=webp&s=31d2c3fb4c8c6e22b563723847267feed31ed448)
|
||||
|
||||
Debt Cycles
|
||||
|
||||
The credit cycle undergoes both expansionary and contractionary phases. Let's take a look at the four phases of a typical [credit cycle](https://www.investopedia.com/terms/c/credit-cycle.asp).
|
||||
|
||||
Expansion: Under strong economic conditions, corporate cash flows improve due to strong consumer confidence and the increase in financial institutions' lending efforts. Easier access to capital markets fosters an ideal environment for business growth and increase in financial leverage for enterprises.
|
||||
|
||||
Downturn: The credit cycle downturn is typically due to an economic slowdown or potential recession, which leads to tighter credit standards. Since the credit downturn is often preceded by peak business expansion and high financial leverage, the slow business growth and low earnings experienced by businesses could lead to potential defaults.
|
||||
|
||||
Repair: The credit cycle downturn is followed by the repair phase, which simply indicates the emergence from the economic downturn. Here, companies start to focus on strengthening their balance sheets by cutting costs and reducing financial leverage.
|
||||
|
||||
Recovery: In the recovery phase, confidence levels start to improve as corporate balance sheets begin to look better with relatively low financial leverage. Financial institutions also tend to start loosening their lending standards.
|
||||
|
||||
Let's look at the US as an example. As you can [see below](https://blogs.cfainstitute.org/investor/2019/08/05/edward-altman-where-are-we-in-the-credit-cycle/), as we continue through the expansion phase of the credit cycle, companies borrow more debt to invest in new products or services. Once a recession hits, many of these businesses are forced to de-lever (pay back debts) and those which aren't able to de-lever, go into bankruptcy. (notice we are LONG overdue for a recession and bankruptcy spike)
|
||||
|
||||
[](https://preview.redd.it/bszlb98wu7a71.png?width=609&format=png&auto=webp&s=9fe0f78c85e4a5d0cb4311e9c7ce273069acbab2)
|
||||
|
||||
Bankruptcy Cycles
|
||||
|
||||
The Great Depression
|
||||
|
||||
The last debt supercycle began [cresting in the 1930s](https://www.lynalden.com/great-depression/). The US appeared to be poised for economic recovery following the stock market crash of 1929, until a series of bank panics in the [fall of 1930 turned the recovery into the beginning of the Great Depression](https://www.econlib.org/library/Enc/GreatDepression.html).
|
||||
|
||||
[](https://preview.redd.it/gffgb6yyu7a71.png?width=618&format=png&auto=webp&s=6a201c6ee8008617e8d6f0c2056bba4df5bbbb39)
|
||||
|
||||
When the crisis began, over 8,000 commercial banks belonged to the [Federal Reserve System](https://www.federalreserveeducation.org/about-the-fed/structure-and-functions), but nearly 16,000 did not. Those nonmember banks operated in an environment similar to that which existed before the Federal Reserve was established in 1914. That environment harbored the causes of banking crises.
|
||||
|
||||
One cause was the practice of counting checks in the process of collection as part of banks' cash reserves. These 'floating' checks were counted in the reserves of two banks, the one in which the check was deposited and the one on which the check was drawn. In reality, however, the cash resided in only one bank.
|
||||
|
||||
Bankers at the time referred to the reserves composed of float as fictitious reserves (again, rehypothecation anyone?). The quantity of fictitious reserves rose throughout the 1920s and peaked just before the financial crisis in 1930. This meant that the banking system as a whole had fewer cash (or real) reserves available in emergencies.
|
||||
|
||||
[](https://preview.redd.it/0zn082jfv7a71.png?width=621&format=png&auto=webp&s=93feba293b300dcc2878e402144b9647b67a13cd)
|
||||
|
||||
Bank Run (Suspension of Accts)
|
||||
|
||||
Another issue was the inability to mobilize bank reserves in times of crisis. Nonmember banks kept a portion of their reserves as cash in their vaults and the bulk of their reserves as deposits in "correspondent banks" in designated cities. Many, but not all, of the ultimate correspondents belonged to the Federal Reserve System.
|
||||
|
||||
This reserve pyramid limited country banks' access to reserves during times of crisis. When a bank needed cash, because its customers were panicking and withdrawing funds en masse, the bank had to turn to its correspondent, which might be faced with requests from many banks simultaneously or might be beset by depositor runs itself.
|
||||
|
||||
[](https://preview.redd.it/dca38vzkv7a71.png?width=639&format=png&auto=webp&s=9f3a808d29d1da1fe48a6c7adb37a5617a94c768)
|
||||
|
||||
Bank Suspensions
|
||||
|
||||
On November 7, 1930, one of Caldwell's (a large financial conglomerate that lost millions in stock market speculation) principal subsidiaries, the Bank of Tennessee (Nashville) closed its doors. On November 12 and 17, Caldwell affiliates in Knoxville, Tennessee, and Louisville, Kentucky, also failed.
|
||||
|
||||
The failures of these institutions triggered a correspondent bank cascade that forced scores of commercial banks to suspend operations. In communities where these banks closed, depositors panicked and withdrew funds en masse from other banks. Panic spread from town to town. Within a few weeks, hundreds of banks suspended operations. About one-third of these organizations reopened within a few months, but the majority were liquidated ([Source](https://www.federalreservehistory.org/essays/banking-panics-1930-31)). Businesses that relied on loan financing started to collapse, and unemployment started to climb.
|
||||
|
||||
[](https://preview.redd.it/nc8mr0yov7a71.png?width=621&format=png&auto=webp&s=067a8cf9a4450b0f83516349305423f0a8a4b77a)
|
||||
|
||||
Soup Line
|
||||
|
||||
What followed was a protracted period of bank runs and panics lasting for years. Contrary to common belief, not all bank runs happened at the same time- some banks experienced one or two runs- others more than that. The Great Depression was a series of panics, rather, that culminated in a near-complete collapse of the banking system and a ban on gold as legal tender by FDR in [Executive Order 6102](https://en.wikipedia.org/wiki/Executive_Order_6102).
|
||||
|
||||
In the wake of the crisis, several key financial reforms were made. Among them were the creation of FDIC ([Federal Deposit Insurance Corporation](https://www.investopedia.com/terms/f/fdic.asp)) which was created in 1933 to "insure" bank deposits with government funds. This, it was hypothesized, would stop bank runs and restore confidence in the system. Another reform was the creation of the [Glass- Steagall Act](https://www.federalreservehistory.org/essays/glass-steagall-act), a key legal provision that forced commercial and investment banks to remain separate entities.
|
||||
|
||||
[](https://preview.redd.it/9vjwadgrv7a71.png?width=539&format=png&auto=webp&s=6ae445fd88ae1b67eb88ccbff5f778324a6ae1c5)
|
||||
|
||||
Signing of Glass-Steagall
|
||||
|
||||
However, both of these in time would serve to further increase risk, not reduce it. The FDIC, for example, insured $100k (later updated to $250K during 2008) of bank deposits. This was supposedly done for the benefit of the client, but many overlook that it also greatly benefited the bank. When you deposit cash into a bank, it is an asset to you- but to the bank, this is a liability- it represents a cash amount that they will have to pay out to you upon your request. By insuring the deposit, the bank gets essentially free insurance on their liabilities, which allows them to justify taking more leverage.
|
||||
|
||||
Glass- Steagall's separation of banks was an amazing step at reforming the system- sadly, it was [repealed in 1999](https://en.wikipedia.org/wiki/Aftermath_of_the_repeal_of_the_Glass%E2%80%93Steagall_Act) by Bill Clinton under the [Gramm--Leach--Bliley Act](https://en.wikipedia.org/wiki/Gramm%E2%80%93Leach%E2%80%93Bliley_Act) (GLBA). Commercial banks are where you deposit funds, get mortgages, small business loans, and personal lines of credit- Investment banks are firms that underwrite financial transactions, create derivatives, and speculate in the market.
|
||||
|
||||
By combining the two, banks are essentially allowed to bet with depositors' money- and if they fail, they can rightly justify to regulators that their collapse would end in financial calamity for millions of working-class depositors who would lose everything since their accounts would be suspended. Thus, they become "Too Big to Fail" and receive Federal Govt bailouts, no matter how reckless they have been.
|
||||
|
||||
([Second half of Part 3 to be posted shortly, linked here](https://www.reddit.com/r/Superstonk/comments/oh0m2s/hyperinflation_is_coming_the_dollar_endgame_part/))
|
||||
|
||||
(Side note: I've been accused of being a shill/FUD spreader for the first two posts- please know this is NOT my intention! I cleared this series with Mods, ([PROOF](https://drive.google.com/file/d/1HlM0vR0Mguo83k6KKKQg5HKyCZaLrOHQ/view?usp=sharing)) but if you think this is FUD/SHILLY then downvote/comment and we can discuss further.)
|
||||
@ -0,0 +1,232 @@
|
||||
Hyperinflation Is Coming- The Dollar Endgame Part 3.5- "The Money Machine"
|
||||
==========================================================================
|
||||
|
||||
| Author | Source |
|
||||
| :----: | :----: |
|
||||
| [u/peruvian_bull](https://www.reddit.com/user/peruvian_bull/) | [Reddit](https://www.reddit.com/r/Superstonk/comments/oh0m2s/hyperinflation_is_coming_the_dollar_endgame_part/) |
|
||||
|
||||
---
|
||||
|
||||
[DD 👨🔬](https://www.reddit.com/r/Superstonk/search?q=flair_name%3A%22DD%20%F0%9F%91%A8%E2%80%8D%F0%9F%94%AC%22&restrict_sr=1)
|
||||
|
||||
[(Apes, this is a continuation of Part 3, please find the first half of Part 3 here)](https://www.reddit.com/r/Superstonk/comments/ogzoco/hyperinflation_is_coming_the_dollar_endgame_part/)
|
||||
|
||||
The Money Illusion
|
||||
|
||||
[In 2008](https://krugman.blogs.nytimes.com/2010/08/11/debt-in-the-30s/), we were at the end of a major debt supercycle. The frenzied mortgage lending and securitization in the financial sector, along with massive consumer credit borrowing, had set the U.S. up for a major crisis. In relative terms, we were at a 27% HIGHER total debt to GDP ratio than the Great Depression.
|
||||
|
||||
These massive debt loads were coming home to roost, manifesting first as a crisis in subprime but then quickly moving to prime mortgages, corporate debt markets, money markets, and even the consumer credit markets. As discussed in Part 2, NY Fed Pres Tim Geitner stated that during the darkest days of 2008 the inter-bank lending market was freezing up, and we were "[days away from the ATMs not working](https://www.youtube.com/watch?v=QozGSS7QY_U)".
|
||||
|
||||
[](https://preview.redd.it/rfxp8w0v18a71.png?width=482&format=png&auto=webp&s=bdd16cb4fcc7a4d1fd966a5be51e838a07dc2edd)
|
||||
|
||||
Total US (Public+Private) Debt to GDP
|
||||
|
||||
But, this didn't happen. Ben Bernanke, the Chairman of the Federal Reserve, was a self avowed student of the Great Depression- and was determined not to let it happen again. He, along with Treasury Secretary Hank Paulson (Former CEO of Goldman Sachs) and Tim Geitner, created new lending facilities and MBS purchase programs in order to swallow the massive amounts of toxic assets the system had created.
|
||||
|
||||
Paulson and Bernanke technically had no legal authority to create these programs, but in a crisis, all caution goes out the window. [TARP](https://www.investopedia.com/terms/t/troubled-asset-relief-program-tarp.asp) and other programs authorized by the Treasury bought billions of dollars of MBS, funded by T-bond issuances. This chart shows [US Govt Debt as a % of GDP through today](https://fred.stlouisfed.org/series/GFDEGDQ188S): (notice the spike in debt during and after 2008)
|
||||
|
||||
[](https://preview.redd.it/ujn9zuyw18a71.png?width=625&format=png&auto=webp&s=0ae7d013a9908e1a43cf2d3be8e3a2646f4ac06a)
|
||||
|
||||
US Government Debt To GDP
|
||||
|
||||
The US borrowed heavily- TARP alone was authorized for $700 billion. The Treasury did not have the funds to support this so it issued billions of dollars of T-Bonds. Banks, hedge funds, other governments, and the Fed all bought these bonds en masse.
|
||||
|
||||
Remember, only the Treasury has the ability to SPEND, and only the Fed has the ability to LEND/PRINT. The Fed was created as a private institution to "protect" the government from reckless money-printing. The [Primary Dealers](https://www.investopedia.com/terms/p/primarydealer.asp) (banks approved to trade directly with the Govt) buy Govt bonds from the US Treasury, and turn around and sell these bonds to the Fed or other third parties. If you're confused about how the system works, I recommend watching [this video on how the financial system functions](https://www.youtube.com/watch?v=iFDe5kUUyT0&list=PLF_lD6tTQahfNDvjbfl2OJQWxHBSDYUcA&index=7).
|
||||
|
||||
In the equity markets, as we started bottoming in the first quarter of 2009, hedge funds, banks, and family offices began loading up on margin debt again. This renewed confidence in the banking system and overall lending capacity began [pushing equity markets](https://www.advisorperspectives.com/dshort/updates/2021/06/16/margin-debt-and-the-market-up-1-7-in-may-continues-record-trend) back up.
|
||||
|
||||
[](https://preview.redd.it/pbrzfxpz18a71.png?width=638&format=png&auto=webp&s=55dd56a772f393a4df2969eb153c93f97c37a581)
|
||||
|
||||
Margin Debt and Stock Market Rally
|
||||
|
||||
Further stabilizing the markets was the Federal Reserve with their massive Quantitative Easing program. In 2008, the [Federal Reserve's Balance Sheet ballooned](https://fred.stlouisfed.org/series/WALCL)- assets (Treasuries and MBS) grew from $880 Billion pre-crisis, to $2 Trillion immediately after, and eventually over $4T by 2014. Many economists, particularly those with a libertarian bent, such as Peter Schiff, immediately decried this reckless behavior and predicted immediate hyper-inflation as early as 2011.
|
||||
|
||||
[](https://preview.redd.it/c3xymxf228a71.png?width=617&format=png&auto=webp&s=6022846b09f94c79188be23c66859b95a342063b)
|
||||
|
||||
Federal Reserve Balance Sheet
|
||||
|
||||
When the Fed buys assets, it is completely different from any other institution buying. Pension plans or mutual funds use the savings of the investors of the fund. Because that money came either from working, or from other investments, it represents NO net increase in money supply. The money they received HAD to come from someone else, for a good/product/service/asset they created or provided.
|
||||
|
||||
However, the Fed has no taxing authority, no savings, no funds to speak of at all- EVERYTHING the Fed buys it purchases through money it PRINTS. Thus, Fed Balance Sheet expansion=money printing. The Fed printed $2T in the two years following 2008.
|
||||
|
||||
This rampant money printing rightly worried experts and pundits in the media- but the inflation they feared never came. They were flat out WRONG. Why?
|
||||
|
||||
Most of the new money that was printed went directly into the banking system. Lyn Alden describes it brilliantly-
|
||||
|
||||
"Leading into the financial crisis, only about 13% of bank reserve assets consisted of cash (3%) and Treasury securities (10%). The rest of their assets were invested in loans and riskier securities. This was also at a time when household debt to GDP reached a record high, as consumers were caught up in the housing bubble.
|
||||
|
||||
That over-leveraged bank situation hit a climax into the 2008/2009 crisis, coinciding with record high debt-to-GDP among households, and was the apex of the long-term private (non-federal) debt cycle. When banks are that leveraged with very little cash reserves, even a 3% loss in assets results in insolvency. And that's what happened; the banking system as a whole hit a peak total loan charge-off rate of over 3%, and it resulted in a widespread banking crisis" (I can't link source, it keeps getting the post taken down- I will post it in comments).
|
||||
|
||||
[](https://preview.redd.it/h2e3zan728a71.png?width=621&format=png&auto=webp&s=21227fa9075245823c0e463a9626cf0bd5ba924e)
|
||||
|
||||
Bank Recapitalization
|
||||
|
||||
Thus, the new money went to recapitalize banks and shore up their balance sheets to defend them from bankruptcy- it stayed in untouchable bank reserves, and never entered circulation.
|
||||
|
||||
The money that didn't go to repair bank balance sheets flowed directly into the markets - Let's walk through it.
|
||||
|
||||
There are two different economies-[ the real economy, and the financial economy. ](https://www.mdpi.com/1911-8074/14/3/129/htm)The tidal wave of new money the Fed was creating did not cause inflation (in the traditional sense), because the money did not flow into the real economy- the goods, products and services that everyone consumes on a daily basis. The money instead flowed into the Financial economy- bond markets, stock markets, private equity funds, commodities, Forex markets, etc.
|
||||
|
||||
[](https://preview.redd.it/b8v6b23a28a71.png?width=635&format=png&auto=webp&s=60f2d1ae42bdad9f98b92f03ebe1b7903c879b88)
|
||||
|
||||
Financial Economy vs Real Economy
|
||||
|
||||
When you give a bank $100M, it doesn't go out and buy $100M worth of Big Macs and Kleenex- the bank puts these funds into investments, generally either in the form of loans or in the form of equities or equity derivatives. Thus, the funds that flowed into the banks are stored up almost exclusively in the financial system, or get pushed into loans to consumers.
|
||||
|
||||
"Wait a second!"- you say. "The Fed printed money to buy T-Bonds- The Treasury usually spends funds that go into the real economy-- so THAT should have caused inflation, right?"
|
||||
|
||||
Yes, this is typically what happens. But, during and after the 2008 financial crisis the majority of Treasury expenditures went to programs that were stabilizing the financial system (TARP+ TAF+ TLGP+ Others). So, the money that would have been spent by govt agencies in the real economy [instead just flowed back to banks and financial institutions](https://www.stlouisfed.org/publications/regional-economist/january-2011/a-closer-look-brassistance-programs-in-the-wake-of-the-crisis).
|
||||
|
||||
Typically in a recession the Treasury will increase spending to cushion the blow to workers- and in 2009 they did extend a few unemployment benefits. But, by and large, Congress authorized few benefit programs for workers, and the [average time on the benefit decreased after a slight bump in 2009](https://www.nytimes.com/2021/01/21/business/economy/unemployment-insurance.html).
|
||||
|
||||
[](https://preview.redd.it/345yskvc28a71.png?width=607&format=png&auto=webp&s=09c1baf172e55f5753b5542006f970280e3a7725)
|
||||
|
||||
Average Time on Benefit
|
||||
|
||||
Thus, the amount of freshly-printed money that reached the real economy was minimal, and whatever money did reach it largely acted to counteract deflationary forces- it wasn't enough to actually induce inflation. The government did little to stop foreclosures, or provide aid to small businesses. [Unemployment spiked](https://www.macrotrends.net/1377/u6-unemployment-rate), and due to the [Phillips Curve Principle](https://courses.lumenlearning.com/boundless-economics/chapter/the-relationship-between-inflation-and-unemployment/#:~:text=The%20Phillips%20curve%20shows%20the%20relationship%20between%20inflation%20and%20unemployment,run%20Phillips%20curve%20was%20stable.) (covered in Pt 1), this put a dampening effect on inflation.
|
||||
|
||||
[](https://preview.redd.it/9dxis4se28a71.png?width=612&format=png&auto=webp&s=d9a66852c917d5a025c00f46900e4d16a4a180c4)
|
||||
|
||||
Unemployment Rates
|
||||
|
||||
The funds the Federal Reserve had created, therefore, created no inflation in the real economy- instead they [flowed to the financial economy](https://twitter.com/Mayhem4Markets/status/1411139236435275779?s=20) and inflated financial assets. This started off the [largest and longest bull market run in U.S. Stock market history](https://www.investopedia.com/market-milestones-as-the-bull-market-turns-10-4588903)- easily beating emerging and other developed countries' equity markets.
|
||||
|
||||
[](https://preview.redd.it/mpg5b29h28a71.png?width=620&format=png&auto=webp&s=5f5621475cd0ecbd06d8897592ca085854683fc1)
|
||||
|
||||
Massive US Stock Market Rally
|
||||
|
||||
[Keynesian economists](https://www.investopedia.com/terms/k/keynesianeconomics.asp#:~:text=Keynesian%20economics%20is%20a%20macroeconomic,output%2C%20employment%2C%20and%20inflation.&text=Based%20on%20his%20theory%2C%20Keynes,economy%20out%20of%20the%20depression.) lauded this as an accomplishment- they believed they were creating what is called a "[Wealth Effect](https://www.investopedia.com/terms/w/wealtheffect.asp)" - a theory that stated that as people's financial wealth increased, they would be induced to do more spending and investment- thus, by propping up the stock market, they would stimulate the real economy. This is awfully convenient for the rich- [the top 10% own 85% of the equity markets,](https://www.cnbc.com/2020/08/27/wealth-gap-grows-as-rising-corporate-profits-boost-stock-holdings-controlled-by-richest-households.html) and thus have seen their wealth balloon by over 186% while growth for everyone else stagnated.
|
||||
|
||||
Ironically this theory has it exactly backwards- real economic growth should drive the stock market, not the other way around. But, convinced of their theories, economic policymakers continued to pump ever increasing sums into the financial system.
|
||||
|
||||
When you divide stock market performance by the Fed's Balance sheet, you see that there has been basically NO real growth since 2008.
|
||||
|
||||
[](https://preview.redd.it/7locky7n28a71.png?width=740&format=png&auto=webp&s=3c21adbd363d10699e28ae34f0d4dc4b09a9e777)
|
||||
|
||||
The Rally is an Illusion
|
||||
|
||||
The entire "rally" we have experienced for the past 12 years has been nothing but an illusion- it is simply the result of vast money inflows into the financial system. Banks and financial institutions will do everything they can to convince you that the high stock market valuations are justified by fundamental growth.
|
||||
|
||||
This is wrong- these valuations are NOT justified. Insane levels of money printing and debt leverage have created extremely dislocated equity markets. For example, [Square (SQ)](https://www.nasdaq.com/market-activity/stocks/sq) has a forward [PE ratio](https://www.investopedia.com/terms/p/price-earningsratio.asp) of 499.87- it currently doesn't pay a dividend, but let's assume it paid a 3% [dividend payout ratio ](https://www.investopedia.com/terms/d/dividendpayoutratio.asp)(which is rare for tech stocks) - if that were the case, it would take 14,996 YEARS for the dividends to pay pack the price of ONE SHARE. (449.87/0.03).
|
||||
|
||||
To summarize, see [this image](https://www.reddit.com/r/Superstonk/comments/njmqe2/were_approaching_the_endgame/) from a post I made a month back- all the warning lights are blinking red. The markets are at the extreme end of the range by almost every valuation metric- and no one seems to care.
|
||||
|
||||
[](https://preview.redd.it/vpw34xbs28a71.png?width=409&format=png&auto=webp&s=9ed5bd8caef1db4d622b2b3532425d130cfb5575)
|
||||
|
||||
Summary of Recent Warnings
|
||||
|
||||
The markets are slowly being "walked up" every day. Today, the ultimate price insensitive buyer (the Fed) is now plowing $120B a month into Treasuries and MBS, and the Primary Dealers now have to turn around and put their money somewhere. The bond market is already a trap with 2% yields, and 5% inflation. There's no more profit potential there, so these institutions are forced to buy equities if they want any returns. [The Fed is killing whatever is left of price discovery.](https://twitter.com/NorthmanTrader/status/1410296365012459521?s=20)
|
||||
|
||||
[](https://preview.redd.it/pz00pg3w28a71.png?width=736&format=png&auto=webp&s=2149d1cc11b5cd1174492382ce230c1f566d7979)
|
||||
|
||||
SPX grinding higher daily
|
||||
|
||||
Four billion dollars or so a day is being pumped into the system- and going straight to the stock markets.
|
||||
|
||||
Further, to stimulate growth in the real economy, [policymakers dropped interest rates to near 0% in late 2008 ](https://fred.stlouisfed.org/series/EFFR)to induce bank lending to get consumers to borrow and spend again. ([70% of our economy is consumption](https://fred.stlouisfed.org/series/DPCERE1Q156NBEA) due to the factors discussed in Part 1).
|
||||
|
||||
This did create massive loan demand- basically every sector of the US economy began borrowing en masse. The Fed was able to "reflate" the bubble and allow the economy to survive on debt financing to "re-invigorate the economy". Fast-forward to today, and a decade of pinning rates to the zero-bound has us breaking records in terms of debt loads:
|
||||
|
||||
[Student Loan Debt](https://educationdata.org/student-loan-debt-statistics):
|
||||
|
||||
[](https://preview.redd.it/2kzhfp0y28a71.png?width=604&format=png&auto=webp&s=a9db6ae3ff7854e90e32f27a2aed7e6601ae625a)
|
||||
|
||||
Student Loan Debt
|
||||
|
||||
[Corporate Debt:](https://www.washingtonpost.com/business/2020/03/10/coronavirus-markets-economy-corporate-debt/)
|
||||
|
||||
[](https://preview.redd.it/t59yd1e038a71.png?width=615&format=png&auto=webp&s=93d47f8d063b09e0f329d737688fcea732fe4582)
|
||||
|
||||
Corporate Debt to GDP
|
||||
|
||||
[Consumer Credit Card Debt](https://wolfstreet.com/2020/08/09/the-state-of-the-american-debt-slaves-q2-2020-the-credit-card-phenomenon/):
|
||||
|
||||
[](https://preview.redd.it/2of0cde238a71.png?width=422&format=png&auto=webp&s=6d04f2821f8e90fb9e75fe0a3023b8bae50fe5f9)
|
||||
|
||||
Consumer Credit as % of GDP
|
||||
|
||||
[Auto Loan Debt](https://fred.stlouisfed.org/series/MVLOAS).
|
||||
|
||||
[](https://preview.redd.it/32a1dkwc48a71.png?width=599&format=png&auto=webp&s=8b9c9816a63f3322686d0fdaaba9e8271426b0f5)
|
||||
|
||||
Auto Loans
|
||||
|
||||
I could go on and on, but you get the point. Now, the entire system is overleveraged- the cancer has spread, and it has infected virtually every single sector of the economy.
|
||||
|
||||
People keep saying that we "kicked the can" of 2008 down the road. This is WRONG. We kicked the can UP THE STAIRS- meaning, we not only delayed the problem, but made sure it would get WORSE, since we borrowed MORE to paper over the old debts and worthless securities the system had created.
|
||||
|
||||
A fascinating aspect of our recent financial history is that [the bailouts are exponentially growing](https://www.youtube.com/watch?v=GT1WqIkg9es&t=56s)- this is due to the simple fact that the entity giving the bailout has to have a balance sheet multiples larger than the firm receiving the bailout, and government guarantees of banks induce reckless speculation. For example, to bailout a bank with $10B in mark-to-market losses, you need a bank with a $20 or $30B capital surplus, to absorb the loss and keep the depositors and creditors satisfied that the bank giving the bailout won't go under.
|
||||
|
||||
In [1998, a hedge fund called LTCM ](https://www.thebalance.com/long-term-capital-crisis-3306240)was near collapse- [it had leveraged itself over 25-1](https://sites.duke.edu/djepapers/files/2016/08/prabhu.pdf), using complex algorithms made by Nobel Prize winning economists to predict bond prices. They had made massive derivative bets buying Russian bonds (among other things) - and when the Russian government defaulted in August 1998, their positions began to unravel.
|
||||
|
||||
The massive debt and derivative exposure they had created was threatening to pull several large banks down with it. The Fed stepped in during September to organize a $3.5 Billion bailout, funded by 12 large banks. According to James Rickards, General Counsel of the LTCM Bailout- the US equity and bond markets were "[close to being completely shut down](https://www.youtube.com/watch?v=P4_1pwsm5LY&list=PLE88E9ICdiphYjJkeeLL2O09eJoC8r7Dc&index=8)" during the worst of that crisis. (start at 16:30)
|
||||
|
||||
In 2008, the entire US financial system was nearing collapse and desperately needed a bailout. A massive bank run had begun. Congress stepped up and provided- in the end spending over [$498 Billion of taxpayer funds](https://mitsloan.mit.edu/ideas-made-to-matter/heres-how-much-2008-bailouts-really-cost). However, the Fed also provided a bailout (though QE), eventually [buying over $1.7 Trillion of MBS](https://fred.stlouisfed.org/series/WSHOMCB).
|
||||
|
||||
Since the Great Financial Crisis, the banking system debt crisis has now become a government debt crisis, and indeed an economic debt crisis- and this debt has spread worldwide. Equity and bond markets have continued to march up, despite fundamentals. This new financial paradigm was rightly termed "[The Everything Bubble](https://www.amazon.com/dp/B0794RLM8R/ref=dp-kindle-redirect?_encoding=UTF8&btkr=1)"
|
||||
|
||||
[](https://preview.redd.it/b01f8f4638a71.png?width=601&format=png&auto=webp&s=d91ead1be1711bb17666e242bde41e1b9d0fbc5f)
|
||||
|
||||
Total World Debt
|
||||
|
||||
[Total (Govt+Private) Global Debt](https://www.axios.com/global-debt-gdp-898959ed-f96a-4c4d-85a3-5d3cc419631f.html) now stands at staggering $281 Trillion, or 356% of GDP. We've never been here before- we are now navigating uncharted waters. The next bailout will have to be bigger- a LOT bigger.
|
||||
|
||||
Avalanches
|
||||
|
||||
[](https://preview.redd.it/mglsuam938a71.png?width=622&format=png&auto=webp&s=21330913e64427c381233b2f82f3f285d99f0610)
|
||||
|
||||
Avalanche
|
||||
|
||||
Imagine a snowfield on an alpine slope, above a small town. A few inches of snow falls. Everything is fine. More snow falls. Still nothing happens. A blizzard moves in. A day later, the snowfield reaches critical mass. Then, a disturbance happens- it could be a deer foraging for food, or a hapless skier exploring the backcountry. The snow starts sliding, pushing the snow below it. Positive feedback loops start to engage. The field begins to slide- now an avalanche has begun. The town is wiped out.
|
||||
|
||||
The financial crisis was the beginning of a debt avalanche- it's likely that over 70% of the major banks, mortgage brokers, and other financial institutions would have gone bankrupt, superseding the Great Depression-era record of 30%. Thousands of private and public companies would have gone bankrupt. Real estate and equity markets would have entered a freefall lasting for years, and unemployment would likely have spiked past 30%, bringing back the soup lines not seen since 1936.
|
||||
|
||||
Instead, policymakers kicked the can up the stairs- they issued massive amounts of government debt to paper over the 2008 crisis, and incentivized excessive borrowing in the private sector. The fundamental factors that caused the crisis (unregulated derivatives, bank combinations, excessive leverage, lack of oversight) were never resolved. As [u/Criand](https://www.reddit.com/u/Criand/) so elegantly puts it, 2008 never ended. Now, with[ US Government Debt standing at over $28 Trillion](https://fred.stlouisfed.org/series/GFDEBTN), there are only tough choices ahead. We will soon reach a point where the interest payments alone on the debt supersede all US Tax Revenues- when that happens, we will have traveled beyond the event horizon- [there will be no coming back](https://www.cbo.gov/publication/56598). The debt will be IMPOSSIBLE to pay off. (This is according to the governments own projections!)📷
|
||||
|
||||
[](https://preview.redd.it/rn0jnbzg38a71.png?width=795&format=png&auto=webp&s=28f68b2a6a282b563a62669e90c820792a9e7a5a)
|
||||
|
||||
US Government Debt Projection
|
||||
|
||||
The US Government continues to borrow- running a staggering[ $2.1 Trillion deficits for just the first half of 2021](https://bipartisanpolicy.org/report/deficit-tracker/). There is no end in sight. The Biden Administration is pushing for another $[1.2 Trillion in infrastructure spending](https://www.whitehouse.gov/briefing-room/statements-releases/2021/06/24/fact-sheet-president-biden-announces-support-for-the-bipartisan-infrastructure-framework/) this year ON TOP of the already massive deficits. Some politicians are demanding that it be more.
|
||||
|
||||
Day by day, we are adding snow to the mountains above our village. When will end is anyone's guess, but borrowing more will only make the end worse.
|
||||
|
||||
Smoothbrain Overview:
|
||||
|
||||
- Through the magic of Fractional Reserve banking, institutions can loan out much more debt than cash that actually exists. This increases systemic risk.
|
||||
|
||||
- As a result, over 90% of all capital created is in the form of debt. This supercharges debt cycles and can cause massive bank failures.
|
||||
|
||||
- When debt super-cycles crest, and begin the march downwards, massive deleveraging and defaults begin. If the banking system is weak, bank runs begin. (1930s)
|
||||
|
||||
- We were hitting another end of the 80 yr debt cycle in 2008 (1929-2008 (79yrs)). We never de-leveraged the system. Instead, we re-leveraged EVERYTHING even MORE.
|
||||
|
||||
- The Government and the Fed swept in and bailed out the banks. Now the Federal Government is deeply in debt to the[ tune of $28 Trillion](https://fred.stlouisfed.org/series/GFDEBTN).
|
||||
|
||||
- The trillions printed by the Fed were almost exclusively routed to the financial system- creating a new bubble in every single asset class, larger and even more widespread than the 2008 bubble.
|
||||
|
||||
- We never resolved 2008. We only kicked the can up the stairs. The Derivatives monster from Pt 2, along with a massive debt avalanche, will come back with a vengeance.
|
||||
|
||||
- Almost every sector of the US economy, and indeed the world economy, is now greatly overleveraged. Global Total Debt to GDP broke past 350% during Covid.
|
||||
|
||||
- Options are running out for policymakers. Debt borrowing and money-printing cannot continue forever.
|
||||
|
||||
Conclusion:
|
||||
|
||||
The debt crisis will return, but this time, it will be the financial system, US government, and indeed the ENTIRE world economy that needs a bailout- and who has a big enough balance sheet to absorb that? The only answer is the ones with an infinite balance sheet- the Central Banks.
|
||||
|
||||
The idea that anyone can borrow forever, or print money forever, with no consequences, defies basic financial logic. Impossible Objects cannot exist forever. History shows deadly consequences for the nations that venture down either path. The United States is no exception.
|
||||
|
||||
The Fed has already tried to escape this trap in 2018. It failed. Sovereign creditors are losing faith in the US Treasury, and have been since 2015. The walls are closing in, and the ultimate decision must be made.
|
||||
|
||||
The avalanche is coming either way- and we only have two choices. Either we allow ourselves to be buried under a mountain of hyper-deflation, creating a new Great Depression, frozen credit and equity markets, and massive bank failures- or, we burn our way out, using the inferno of money-printing and hyper-inflation.
|
||||
|
||||
BUY, HODL, BUCKLE UP.>>>>>>>TO BE CONTINUED >>>>>>> PART FOUR "AT WORLD'S END"
|
||||
|
||||
(Adding this to clear up FUD- My argument is for hyperinflation to begin in a few years- this is a years- long PROCESS, and will take a long time to play out. It won't happen tomorrow, but we are in the same situation as Germany after WW1. Hyperinflation is GOOD FOR GME--- DEBT VALUE COLLAPSES, MONEY CHASES ASSETS (EQUITIES) pushing the price UP, so shorts will have to cover) BUY AND HOLD.
|
||||
|
||||
Nothing on this Post constitutes investment advice, performance data or any recommendation that any security, portfolio of securities, investment product, transaction or investment strategy is suitable for any specific person. From reading my Post I cannot assess anything about your personal circumstances, your finances, or your goals and objectives, all of which are unique to you, so any opinions or information contained on this Post are just that -- an opinion or information. Please consult a financial professional if you seek advice.
|
||||
|
||||
*If you would like to learn more, check out my recommended reading list [here](https://docs.google.com/document/d/1nSw9odLoExaq0oEBqIHrCK1Xj5KfyjBkGQZ93LTh34g/edit?usp=sharing). This is a dummy google account, so feel free to share with friends- none of my personal information is attached. You can also check out a Google docs version of my[ Endgame Series here](https://docs.google.com/document/d/1552Gu7F2cJV5Bgw93ZGgCONXeenPdjKBbhbUs6shg6s/edit?usp=sharing). I have a folder with all the Dollar Engame DD [here](https://www.reddit.com/r/Superstonk/comments/o4vzau/hyperinflation_is_coming_the_dollar_endgame_part/), and another GME DD folder (just collection of PDFs, not my work) [here](https://drive.google.com/drive/folders/1u3RogFdDU-kQ9XYjNVJKl-acPf1r7wwX?usp=sharing).
|
||||
|
||||
(Side note: I've been accused of being a shill/FUD spreader for the first two posts- please know this is NOT my intention! I cleared this series with Mods, ([PROOF](https://drive.google.com/file/d/1HlM0vR0Mguo83k6KKKQg5HKyCZaLrOHQ/view?usp=sharing)) but if you think this is FUD/SHILLY then downvote/comment and I can discuss further.)
|
||||
@ -0,0 +1,326 @@
|
||||
Math Black Magic Vol. 1: Why It Is Mathematically Impossible for Hedgies To Unfuk Themselves
|
||||
============================================================================================
|
||||
|
||||
| Author | Source |
|
||||
| :-------------: |:-------------:|
|
||||
| [u/nydus_erdos](https://www.reddit.com/user/nydus_erdos/) | [Reddit](https://www.reddit.com/r/Superstonk/comments/nw8281/math_black_magic_vol_1_why_it_is_mathematically/) |
|
||||
|
||||
---
|
||||
|
||||
[DD 👨🔬](https://www.reddit.com/r/Superstonk/search?q=flair_name%3A%22DD%20%F0%9F%91%A8%E2%80%8D%F0%9F%94%AC%22&restrict_sr=1)
|
||||
|
||||
DISCLAIMER: My first DD. Not financial advice. All credit to the authors of cited works. I am not trying to karma farm or be dramatic by breaking this up into parts. I tried to post it all at once, but the picture limit had other plans.
|
||||
|
||||
ACKNOWLEDGEMENTS:
|
||||
|
||||
Shout out to [u/sososhibby](https://www.reddit.com/u/sososhibby/). One of their comments got me started down this rabbit hole and they were nice enough to give my work a quick check before I posted. They've also posted about this topic as well: [Part 1](https://www.reddit.com/r/Superstonk/comments/nmaaaa/john_d_finnerty_excerpt_from_hoc_3_explained_pt1/), [Part 2](https://www.reddit.com/r/Superstonk/comments/nmdbzz/excerpt_from_hoc3_relevant_af_20_finnerty_fer/)
|
||||
|
||||
Also, [u/JNWolman](https://www.reddit.com/u/JNWolman/) was all over this topic months ago. IMO, the post didn't get the exposure it was due. Give it a [read](https://www.reddit.com/r/GME/comments/mgmbkf/would_the_real_exit_strategy_please_stand_up/).
|
||||
|
||||
--------------------------------------------------------------------------------------------------------------------------------------------------------
|
||||
|
||||
A. What I Hope to Show
|
||||
|
||||
In this volume I hope to present work (by brains much more wrinkled than mine) that show beyond a reasonable doubt, something we all already know: that hedgies are indeed mathematically fuk, in that they have naked shorted AT LEAST the same amount of shares outstanding.
|
||||
|
||||
[u/atobitt](https://www.reddit.com/u/atobitt/)'s [H.O.C. III](https://www.reddit.com/r/Superstonk/comments/nlwqyv/house_of_cards_part_3/) mentions an [academic paper](https://www.sec.gov/comments/s7-08-08/s70808-318.pdf) titled "*Short Selling, Death Spiral Convertibles, and the Profitability of Stock Manipulation*" written March 2005 by John D. Finnerty, a finance professor.
|
||||
|
||||
In the paper, Finnerty lays out a model to examine naked short selling. In particular, he demonstrates that in order to drive a firms price very close to zero, a manipulator MUST naked short AT LEAST the same number of shares as there are shares outstanding, doubling the float.
|
||||
|
||||
-----------------------------------------------------------------------------------------------------------------------------------------------------
|
||||
|
||||
B. Market Model Rundown
|
||||
|
||||
In my opinion, Finnerty's paper is a thing of logical and [mathematical beauty](https://en.wikipedia.org/wiki/Mathematical_beauty). As god tier mathematician Paul Erdős would say, "[This one's from The Book](https://en.wikipedia.org/wiki/Mathematical_beauty#Beauty_and_philosophy)". Finnerty took a very complex system and expressed it elegantly and simply. As a math ape, it literally brought a tear to my eye when I finally understood it; which took me awhile (just because I like math doesn't make my brain any less smooth). There's no confirmation bias as sweet as mathematical confirmation bias.
|
||||
|
||||
However, I am quite aware of my autistic tendencies and know most people and apes have a...*strained* relationship with math, so I read all 73 pages of the paper so you don't have to! I try to lay out his model as concisely as possible as to who are the participants, how the market behaves and why hedgies r thusly fuk.
|
||||
|
||||
MARKET PARTICIPANTS:
|
||||
|
||||
*Informed Investor*
|
||||
|
||||
- Informed investors do short sell, but do not engage in abusive or naked short selling. They locate, borrow and return shares on time.
|
||||
|
||||
- The informed investor has information advantage. They know if the true intrinsic value of the stock is high (*H)* or low *(L)*.
|
||||
|
||||
- This group only shorts stocks that legitimately have low real intrinsic value *(L)*.
|
||||
|
||||
- Assume there is only one informed investor in this model.
|
||||
|
||||
*Manipulator*
|
||||
|
||||
- The manipulator has the information advantage as well. Through research or by observing the informed investor, they know the true intrinsic value of the stock and seek to manipulate the stock below that value.
|
||||
|
||||
- A manipulator can appear as an informed investor to other participants by copying the selling behavior of the informed investor.
|
||||
|
||||
- Manipulator can be a Market Maker (MM).
|
||||
|
||||
> Market makers have lower shorting costs since they can sell on a downtick and do not have to commit that they will be able to borrow shares before they sell short. Market makers are granted these exceptions to facilitate their market-making activities. A strategy a manipulator can employ to reduce its cost of shorting is to register as a market maker for the target stock. If naked shorting, there is zero cost. (Pg. 17, footnote 33)
|
||||
|
||||
- There is only one manipulator in this model.
|
||||
|
||||
*Active Traders*
|
||||
|
||||
- Think of this group as regulation abiding MM's.
|
||||
|
||||
- They can short sell, but do not engage in abusive or naked short selling.
|
||||
|
||||
- Active traders does not have as much information as the manipulator and informed investor. They do not know the true value of the stock.
|
||||
|
||||
- They can interpret market signals and see what the informed investor does, which gives them information advantage over retail investors.
|
||||
|
||||
- They don't know if the informed investor they are watching is actually a manipulator in disguise.
|
||||
|
||||
- They mostly base their moves on what the informed investor (or the disguised manipulator) does and only act after they do.
|
||||
|
||||
- There is more than one active trader.
|
||||
|
||||
*Uninformed Investors*
|
||||
|
||||
- These are old type retail investors, not apes.
|
||||
|
||||
- Uninformed investors have the ultimate information disadvantage, they have no idea how much the stock is really worth.
|
||||
|
||||
- They always stand ready to buy more shares at lower prices than those currently prevailing, since they don't know the true intrinsic value of the stock.
|
||||
|
||||
- This willingness to buy provides consistent cash flow (liquidity) to short sellers.
|
||||
|
||||
- Uninformed investors demand for shares decreases as the amount they possess increases.
|
||||
|
||||
- Once this group knows the true price of the stock they will sell, providing shares to the shorts to cover.
|
||||
|
||||
- There are many uninformed investors.
|
||||
|
||||
*Insiders and Long Term HODL'ers*
|
||||
|
||||
- Passive group that does not take an active role in the market. They neither sell nor buy shares.
|
||||
|
||||
- They exist in the model so there are shares for the shorts to borrow and to set the initial market price.
|
||||
|
||||
- Assume they own all outstanding shares.
|
||||
|
||||
TIME BREAKDOWN:
|
||||
|
||||
The paper has a timeline/progression of how the market behaves. There are four points expressed as time *t*.
|
||||
|
||||
*Time 0*
|
||||
|
||||
- This is right before anything happens and the model is at the initial conditions.
|
||||
|
||||
- All shares are held by insiders and long term investors who do not plan on selling.
|
||||
|
||||
*Time 1*
|
||||
|
||||
- This is when the short sale can be initiated by the the informed investor or the manipulator or, depending on the situation, by both of them.
|
||||
|
||||
- Also during this time the active traders are observing the informed investor (or a manipulator posing as one) and current market signals. They do not act during this time.
|
||||
|
||||
*Time 2*
|
||||
|
||||
- This is when the active trader takes action, they do what they saw the informed investor (or the manipulator posing as one) do.
|
||||
|
||||
- The short sellers from time 1 can short additional shares if they decide to.
|
||||
|
||||
- Market equilibrium forms at this time.
|
||||
|
||||
- The informed investor or the manipulator can sustain a short position until time 3 but it is less expensive to sustain it to time 2 (unless the manipulator naked shorts and/or is a MM).
|
||||
|
||||
*Time 3*
|
||||
|
||||
- This is when the stocks true intrinsic value is revealed to all market participants to be *H* or *L*.
|
||||
|
||||
- This represents the long run, and it may be very costly for the informed investor or the manipulator to maintain a short position (unless the manipulator naked shorts and/or is a MM).
|
||||
|
||||
- If the legitimate shorts have not closed their short position already, this is were they cover.
|
||||
|
||||
- Most of the paper's focus is on what happens at this time.
|
||||
|
||||
MARKET EQUILIBRIUM
|
||||
|
||||
At time 2, the market enters equilibrium. There are two basic forms of equilibrium: pooling and separating.
|
||||
|
||||
*Pooling*
|
||||
|
||||
This type of equilibrium is when the manipulator wants to remain undetected so the other market participants mistake him as an informed investor.
|
||||
|
||||
The advantage to this is that the manipulator stands less of a chance of getting caught or squeezed. On top of this, active traders may pile on to short the stock as well when they see blood in the water. This causes the price to drop even lower, helping the manipulator.
|
||||
|
||||
The disadvantage is that the manipulator loses profit to the extra competition and sole control over the price action.
|
||||
|
||||
*Separating*
|
||||
|
||||
This is when the manipulator doesn't care if they are detected. In some cases, they want to be detected to scare off competition. The advantage is that this strategy maximizes their profit and they have full price control. The disadvantage is they have a greater chance of getting caught or squeezed.
|
||||
|
||||
-----------------------------------------------------------------------------------------------------------------------------------------------------
|
||||
|
||||
E. Demand Curves & The Unravelling Problem
|
||||
|
||||
*General Demand Curve:*
|
||||
|
||||
This whole model is governed by the uninformed investors demand, since they are the buyers. Their demand is highly dependent on the supply of shares. The uninformed traders willingness to hold *Q* shares at time *t* is summarized by the demand curve (Pg. 15):
|
||||
|
||||
[](https://preview.redd.it/zhhgr111fc471.png?width=1375&format=png&auto=webp&s=cc034e8ae681bdc7365ce2ab1851e18fca94cbed)
|
||||
|
||||
General Demand Curve
|
||||
|
||||
- The function *D(Q)* represents the uninformed investors demand which is equal to the price at time *t* represented by *P(t)*.
|
||||
|
||||
- *H* and *L* are the potential true values of the stock revealed to active traders and uninformed investors at time 3.
|
||||
|
||||
- *A* is a constant representing the current market price.
|
||||
|
||||
- *B* is a constant representing the price at which uninformed investors buy, which is lower than the prevailing price.
|
||||
|
||||
- Note that at time zero, all shares are in the hands of long term investors so *P(0) = A*.
|
||||
|
||||
*The Unravelling Problem:*
|
||||
|
||||
If the manipulator is not naked short selling, then they would have to cover at time 2, or at time 3 when the true price is revealed to everyone. This presents what the paper refers to as the unravelling problem.
|
||||
|
||||
This is the issue shorts face when covering their positions. Since retail knows the real price at time 3 their demand curve shifts. Buying to cover at the real price causes the price to increase. Both factors cut into profits.
|
||||
|
||||
*Problem When True Price = H*
|
||||
|
||||
If true price is revealed to be *H* at time 3 then the demand curve shifts to:
|
||||
|
||||
[](https://preview.redd.it/3rhkhwi6fc471.png?width=1406&format=png&auto=webp&s=9d6e0631707e552c444a5d8206535f54bad1b4ca)
|
||||
|
||||
High Value Demand Curve
|
||||
|
||||
This is the worst case scenario for hedgies. Not only did they not suppress the price to *L* they now have to buy to cover. The number of shares retail holds *Q* goes to zero since hedgies have to buy them back, which will push the price to *H* cutting into their tendies.
|
||||
|
||||
*Problem When True Price = L*
|
||||
|
||||
If true price is revealed to be *L*, at time 3 then the demand curve shifts to:
|
||||
|
||||
[](https://preview.redd.it/45sv7u0afc471.png?width=1408&format=png&auto=webp&s=7bcc138e8344e98deab491f8f2b7d77275693377)
|
||||
|
||||
Low Value Demand Curve
|
||||
|
||||
Not as bad as the previous case, but even covering at *L* will push price a little bit higher and cut into the hedgies' tendies.
|
||||
|
||||
-----------------------------------------------------------------------------------------------------------------------------------------------------
|
||||
|
||||
F. Naked Short Selling
|
||||
|
||||
Naked short selling removes the unravelling problem at no cost to the manipulator and it's quite literally free money:
|
||||
|
||||
> Naked short selling and manipulating the price downward provide cash returns to the manipulator, who can withdraw cash from his clearing firm account as the shorted shares are marked to market at progressively lower prices. Through naked shorting, the manipulator realizes these returns without investing any cash (provided the market price never rises above the sale price). (Pg. 34, par. 1)
|
||||
|
||||
> The clearing firm retains the cash proceeds from the short sale to secure the selling broker's delivery obligation. The clearing firm releases cash equal to the reduction in value of the shorted shares as the price of the shares declines (or demands additional cash margin if the share price rises). (Pg. 34, footnote 51)
|
||||
|
||||
Here are some familiar signs of naked short selling:
|
||||
|
||||
> The daily trading volume could be quite high if the manipulator is rapidly turning over its short position, but the daily trading and settlement activity may appear to be normal market making because the dealer's net position on the day does not change. (Pg. 44, footnote 64)
|
||||
|
||||
> Pumping the trading volume also reduces the short interest ratio (short interest divided by the average daily trading volume) to help conceal the manipulation. (Pg. 44, footnote 64)
|
||||
|
||||
Remember naked shorting creates phantom shares which increases the float.
|
||||
|
||||
*True Shares Outstanding:*
|
||||
|
||||
Based on the original demand curve we can calculate the total shares outstanding at time 0. Since this is during the initial conditions, this is the true value of shares outstanding.
|
||||
|
||||
So, since uninformed investors are always willing to buy at a lower price and, hypothetically, if the long term investors decided to sell all outstanding shares *Q* to uninformed traders then price would fall to *L*:
|
||||
|
||||
[](https://preview.redd.it/2lucrstdfc471.png?width=1302&format=png&auto=webp&s=77adeb75401431094301b216caabcb71f4db680c)
|
||||
|
||||
True Shares Outstanding
|
||||
|
||||
*Naked Short Selling in Pooling Equilibrium: Driving Price Close to Zero*
|
||||
|
||||
When True Price = *H*
|
||||
|
||||
Using the previous equations we can find the amount of shares necessary to drive the final price at time 3 close to zero:
|
||||
|
||||
[](https://preview.redd.it/qei47fuifc471.png?width=1284&format=png&auto=webp&s=65ea8f2f04eff9babd339b7c22a3a8f9c655fb7a)
|
||||
|
||||
Shares Needed to Drive Price Close To Zero
|
||||
|
||||
When True Price = *L*
|
||||
|
||||
[](https://preview.redd.it/pedh454ofc471.png?width=1279&format=png&auto=webp&s=fe342a1d0872e3baa28292cd39d15d3cef259de6)
|
||||
|
||||
Shares Needed to Drive Price Close to Zero
|
||||
|
||||
It is also worth noting,
|
||||
|
||||
> The manipulators profit depends on his ability to manipulate the firm's stock price and keep it depressed. The stronger the financial condition of the firm at time 3 (the higher *L* is), the greater the number of shares the manipulator has to sell short at time 3 to drive the price close to zero. (Pg. 45, par. 2)
|
||||
|
||||
*More Shorted Shares than Outstanding:*
|
||||
|
||||
We have the true shares outstanding, we know the amount of shares needed to short an *H* valued company to zero, and the amount of shares needed to short a *L* valued company to zero:
|
||||
|
||||
[](https://preview.redd.it/twctyrcsfc471.png?width=1274&format=png&auto=webp&s=cd8be3285e939cac464dee89025027c780c3eb0b)
|
||||
|
||||
Share Counts
|
||||
|
||||
When Value Is *H*
|
||||
|
||||
> Building a short position of *H/B* to drive *P(3)* to zero would involve naked shorting more shares than the firm has outstanding because *H/B > (A-L)/B*. (Pg. 45, par. 1)
|
||||
>
|
||||
> The manipulator can not drive the share price close to zero unless he can naked short an extraordinary number of shares. (Pg. 45, par. 1)
|
||||
|
||||
So to drive the *H* company to zero hedgies have to naked short *Q_H* shares. But remember our general equations governing the demand curve:
|
||||
|
||||
[](https://preview.redd.it/2pv8j1uxfc471.png?width=1362&format=png&auto=webp&s=b1f6323b28f83ff44706c06252eb8ef1decc802d)
|
||||
|
||||
Hedgies r fuk: High Value Edition
|
||||
|
||||
Proving that if hedgies want to short a company with a high intrinsic value to zero they must naked short more shares than are outstanding.
|
||||
|
||||
When Value is *L*
|
||||
|
||||
> Even if the manipulator's short position is *L/B*, it might still exceed the entire number of shares the firm has outstanding.
|
||||
>
|
||||
> The manipulators profit depends on his ability to manipulate the firm's stock price and keep it depressed. The stronger the financial condition of the firm at time 3 (the higher *L* is), the greater the number of shares the manipulator has to sell short at time 3 to drive the price close to zero. (Pg. 45, par. 2)
|
||||
|
||||
If the final price (*L*) at time three (*P(3)*) is equal to the price at time 2 (i.e. if *L=P(3)=P(2)*) then the manipulator will naked short the same number of shares that the firm has outstanding. This next equation should look familiar:
|
||||
|
||||
[](https://preview.redd.it/vfihc052gc471.png?width=1338&format=png&auto=webp&s=73f9ccd94ca522bfc4f57d548aa1fc0e3b51c2e5)
|
||||
|
||||
Hedgies r fuk: Low Value Edition
|
||||
|
||||
So then if *L>P(2)* then the manipulator will naked short more shares than firm has outstanding. By naked shorting the same number of shares that are outstanding, the manipulator has doubled the float. (Pg. 55, footnote 77)
|
||||
|
||||
Which makes sense: If the price is higher turns out to be higher than they expected then they have to drive price down even more. Naked shorting is effective because it dilutes the float.
|
||||
|
||||
What About Incremental Shorting?
|
||||
|
||||
Almost forgot this case, so I'll have to put it here at the end. I'm not gonna go too much into the math cause it just adds another layer of unneeded complexity.
|
||||
|
||||
Basically you just need to know this, Finnerty proves that unless the manipulator is naked shorting and/or is a MM, it is not profitable to incrementally short sell (i.e. shorting a little, then covering a little, repeat).
|
||||
|
||||
> In a market equilibrium in which the informed investor sells the profit-maximizing number of shares, I show later in the paper that incremental short sales by the manipulator will not be profitable. (Pg. 16, footnote 29)
|
||||
|
||||
This shows how huge of a win the rule changes were. Had apes not gotten them, Shitadel would have continued to abuse their MM privileges and not had to worry about margin call. Now, they can't naked short as freely and its actually costing them to maintain short positions, and its only going to get worse.
|
||||
|
||||
------------------------------------------------------------------------------------------------------------------------------------------------
|
||||
|
||||
In the next volume, I'll explore :
|
||||
|
||||
1. The Majestic Ape Demand Curve
|
||||
|
||||
2. How apes fucked up the hedgies' algorithm
|
||||
|
||||
3. Why short attacks are getting weaker
|
||||
|
||||
4. Exponential & Log Chats
|
||||
|
||||
5. Why it is Impossible to Short Ape Curve Close to Zero
|
||||
|
||||
---------------------------------------------------------------------------------------------------------------------------------------------------
|
||||
|
||||
TL:DR -> Finance professor (not me) mathematically proves that it's impossible to short a stock to zero without naked shorting at least as many shares as there are outstanding, doubling the float in the process.
|
||||
|
||||
Hedgies r fuk.
|
||||
|
||||
BUY, HODL, VOTE
|
||||
|
||||
TA:DR -> Naked 🩳 + (🐒x🦍) + 🚀√🌕 =
|
||||
|
||||
(Hedgies r fuk) 2 + 🍗🍗🍗
|
||||
|
||||
--------------------------------------------------------------------------------------------------------------------------------------------------------
|
||||
|
||||
This post brought to you on behalf of Margery Nesbitt.
|
||||
@ -0,0 +1,208 @@
|
||||
Math Black Magic Vol 2: The Limit Does not Exist!
|
||||
=================================================
|
||||
|
||||
| Author | Source |
|
||||
| :-------------: |:-------------:|
|
||||
| [u/nydus_erdos](https://www.reddit.com/user/nydus_erdos/) | [Reddit](https://www.reddit.com/r/Superstonk/comments/nwy0oz/math_black_magic_vol_2_the_limit_does_not_exist/) |
|
||||
|
||||
---
|
||||
|
||||
[DD 👨🔬](https://www.reddit.com/r/Superstonk/search?q=flair_name%3A%22DD%20%F0%9F%91%A8%E2%80%8D%F0%9F%94%AC%22&restrict_sr=1)
|
||||
|
||||
DISCLAIMER: Second part of my first DD. Not financial advice. All credit to the authors of cited works. I am not trying to karma farm or be dramatic by breaking this up into parts. I tried to post it all at once, but the picture limit had other plans.
|
||||
|
||||
-----------------------------------------------------------------------------------------------------------------------------------------------------
|
||||
|
||||
ACKNOWLEDGEMENTS:
|
||||
|
||||
Shout out to [u/sososhibby](https://www.reddit.com/u/sososhibby/). One of their [comment](https://www.reddit.com/r/Superstonk/comments/nm3mtr/relevant_af/) got me started down this rabbit hole and they were nice enough to give my work a quick check before I posted. They've also posted about this topic as well: [Part 1](https://www.reddit.com/r/Superstonk/comments/nmaaaa/john_d_finnerty_excerpt_from_hoc_3_explained_pt1/), [Part 2](https://www.reddit.com/r/Superstonk/comments/nmdbzz/excerpt_from_hoc3_relevant_af_20_finnerty_fer/)
|
||||
|
||||
[u/JNWolman](https://www.reddit.com/u/JNWolman/) was all over this topic months ago. IMO, the post didn't get the exposure it was due. Give it a [read](https://www.reddit.com/r/GME/comments/mgmbkf/would_the_real_exit_strategy_please_stand_up/).
|
||||
|
||||
I'll also be using [charts](https://www.reddit.com/r/Superstonk/comments/nwwy5x/0610_update_broke_the_logfloor_by_1_5_in_linear/) from [u/JTH1](https://www.reddit.com/u/JTH1/), aka "exponential floor guy".
|
||||
|
||||
-----------------------------------------------------------------------------------------------------------------------------------------------------
|
||||
|
||||
A. Topics Explored
|
||||
|
||||
In [Vol. 1](https://www.reddit.com/r/Superstonk/comments/nw8281/math_black_magic_vol_1_why_it_is_mathematically/), I laid out [Finnerty's paper](https://www.sec.gov/comments/s7-08-08/s70808-318.pdf) which mathematically proves that to drive a firms price very close to zero, a manipulator MUST naked short AT LEAST the same number of shares as there are shares outstanding, effectively doubling the float.
|
||||
|
||||
This write up is more of my examination of the implications of Finnerty's paper and how it applies to GME. This is not meant to be proof, more of this smooth brain's musings. Feedback and constructive criticism are welcome. In this volume I'll examine:
|
||||
|
||||
- What I think the hedgies' algorithm and how apes fucked up said algo.
|
||||
|
||||
- I should note, that I believe the algos covered here have been modified since, but the damage has been done.
|
||||
|
||||
- Why short attacks are getting weaker.
|
||||
|
||||
- The negative volume that pops up every so often.
|
||||
|
||||
- Why it is Impossible to Short Ape Curve Close to Zero.
|
||||
|
||||
PROTIP: This volume is a bit more math heavy than the last, but don't let that intimidate you!
|
||||
|
||||
Don't focus too much on the letters, as long as you know who is doing what at each time and what greater than (>) , less than (<) and equal (=) means you'll be good. I'll try to clarify anything that gets too intense.
|
||||
|
||||
-----------------------------------------------------------------------------------------------------------------------------------------------------
|
||||
|
||||
B. Naked Short Selling: Separating Equilibrium
|
||||
|
||||
In separating equilibrium, the manipulator scares away the other participants with unconcealed, aggressive naked shorting. This maximizes profits by eliminating competition. Since the manipulator has price control it doesn't matter whether the time 3 price should be *H* or *L*.
|
||||
|
||||
The lack of competition also makes this strategy a bit more formulaic than the previous examples. The manipulator maximizes his short sale proceeds by naked shorting at time 1 (Pg. 48 par. 1, Pg. 54-55, par. 1):
|
||||
|
||||
[](https://preview.redd.it/n42c0ax4ag471.png?width=1058&format=png&auto=webp&s=042be52553c72a8b726c3cfe08aa169145c5b35e)
|
||||
|
||||
Price at Time 1
|
||||
|
||||
[](https://preview.redd.it/53iy2wm8ag471.png?width=1074&format=png&auto=webp&s=0c529a4731e2fe5e73009d21f13f45017923a87d)
|
||||
|
||||
Price at Time 2
|
||||
|
||||
[](https://preview.redd.it/hku7v10hag471.png?width=1116&format=png&auto=webp&s=cb29b1b65823c35eebd53733bdc417e1d330930c)
|
||||
|
||||
Price at Time 3
|
||||
|
||||
Note the rate of change:
|
||||
|
||||
> This has occurred with a huge volume of naked shorting and a precipitous decrease in share price that first cut the price in half and then reduced it close to zero. (Pg. 46, par. 2)
|
||||
|
||||
I found that statement slightly unclear as the price is reduced by a third then halved. At most it could be an editing mistake, but more than likely it is my smooth brain. Wrinkle brain help is appreciated.
|
||||
|
||||
-----------------------------------------------------------------------------------------------------------------------------------------------------
|
||||
|
||||
C. Inverted Demand Curve
|
||||
|
||||
First, lets put the original general demand curve into slope intercept (i.e. make it easier to graph as a line):
|
||||
|
||||
[](https://preview.redd.it/99u0fkwpbg471.png?width=1079&format=png&auto=webp&s=16e5c56e020759b1add8ca735ed16bf23d230d1b)
|
||||
|
||||
Slope Intercept Demand Function
|
||||
|
||||
This is a line with a downwards slope of *-B*. Recall that in Finnerty's model, *B* is the price that retail buys, which is always lower than the prevailing price. That means that as retail acquires more and more shares, the price/demand will decrease.
|
||||
|
||||
[](https://preview.redd.it/26cayz89cg471.png?width=1052&format=png&auto=webp&s=070d5441380426260557d52bcd1db5fcdd3479e6)
|
||||
|
||||
Demand Curve Comparison
|
||||
|
||||
With apes, however, it works the opposite way. Yes, apes buy at any prices, but what I think fucked up the algorithm is apes buy at higher and higher prices because ape and FOMO. In this case, demand and price increase as supply increases. Meaning that if apes got all the shares, the price would rise to *H* This changes the slope of the demand curve positive:
|
||||
|
||||
[](https://preview.redd.it/mefhrczrcg471.png?width=1280&format=png&auto=webp&s=7ba9489b6191491937bd9e755e43b562fc731947)
|
||||
|
||||
Ape Demand Function
|
||||
|
||||
What I gathered from this is most of the hedgies' problem results from a simple change in sign. I take this a bit further and apply it to the exponential and log curves later on. I figure that the inverse of these functions is what fucked up what the algorithm originally intended.
|
||||
|
||||
*Exponential & Logarithmic Graphs*
|
||||
|
||||
The following list has the floors calculated by [u/JTH1](https://redditpreview.com/u/JTH1) (aka "exponential floor guy") and the inverted version of the curve I hypothesize the hedgies originally had planned:
|
||||
|
||||
[](https://preview.redd.it/a86fowc6eg471.png?width=1291&format=png&auto=webp&s=ddee910bdcee8a375241290b7608a740ad57736d)
|
||||
|
||||
Ape & Hedgie Curves
|
||||
|
||||
Based on this inverse hypothesis, I think this is the ideal curve hedgies wanted:
|
||||
|
||||
[](https://preview.redd.it/ys4mcl3mgh471.png?width=983&format=png&auto=webp&s=95a47f214cc84052888c2cf2182d910e3df536ed)
|
||||
|
||||
Hedgie Curves
|
||||
|
||||
If you want to see the current curve, check out exponential floor guy's posts (the most recent at the time of this writing is linked at the very top of the post).
|
||||
|
||||
D. Pareto Principle & Rate of Change
|
||||
|
||||
(This section is based heavily on a comment by sososhibby. This section makes a lot more sense if you read it. Its linked at the top.)
|
||||
|
||||
*Hedgie Case*
|
||||
|
||||
I thought it was interesting that the author stressed throughout the paper, that price is reduced CLOSE to zero and not zero.
|
||||
|
||||
Remember, in separated equilibrium naked shorting drops the price by a third, then halves it before it quickly drops close to zero.
|
||||
|
||||
That sounded like asymptotic behavior (asymptote = the thing the curve has to approach for the limit to exist, remember *Mean Girls?*), so I was curious to see the progression to zero so I kept it going and halved *P(2)* again and repeated the process with my result. I assume this is happening quickly between time 2 and time 3:
|
||||
|
||||
[](https://preview.redd.it/2o17ngi8lh471.png?width=973&format=png&auto=webp&s=1f44aafd13eb3f81ccb7f1f4db0214a41d84edd0)
|
||||
|
||||
[](https://preview.redd.it/ero04mjalh471.png?width=910&format=png&auto=webp&s=9aa8b4836a4a7b880224998176146a060b2a65e3)
|
||||
|
||||
Price Progression to Close to Zero
|
||||
|
||||
I'd take it further but you get the picture. So I took the points made a scatter plot. Didn't look like much. I got curious and wanted to see if I could fit the negative exponential curve. I had to use some scaling factors, but always try to base them as a proportion of 1.
|
||||
|
||||
[](https://preview.redd.it/ekvd81pmlh471.png?width=876&format=png&auto=webp&s=8c1448d0d623d47ca188bbf95a5e38596b682d2a)
|
||||
|
||||
[](https://preview.redd.it/4ell2arrlh471.png?width=834&format=png&auto=webp&s=7e10e0d89e6c936605b574fe7bfe56cc738fbbd7)
|
||||
|
||||
Hedgie Curve
|
||||
|
||||
Didn't look like much either, but the fact that it had asymptotic behavior at 0.2 or 20 percent. I figured it might be worth mentioning. Maybe somebody else can take it further.
|
||||
|
||||
*Ape Case*
|
||||
|
||||
Remember, in the normal case of naked shorting in separating equilibrium the price is dropped by a third, then halved, then taken close to zero.
|
||||
|
||||
In the ape case, the price increases. This is where the exponential/power function may come into play. I tried to find the rate of change by re-computing values using equations from earlier:
|
||||
|
||||
[](https://preview.redd.it/wpa0e8femh471.png?width=1056&format=png&auto=webp&s=ffb70662e8d057f9ecefcdca7b73ba7c913a845c)
|
||||
|
||||
[](https://preview.redd.it/c7cnltihmh471.png?width=975&format=png&auto=webp&s=fcfce22cebd58f6b95457afe6dafca3b775a1a38)
|
||||
|
||||
Ape Case
|
||||
|
||||
As with the last set of values, I wanted to examine the behavior of the ape curve to find a rate of change. It looks like the price increases by a third, then by 1.25 or 25 percent.
|
||||
|
||||
[](https://preview.redd.it/pekkb7kvmh471.png?width=910&format=png&auto=webp&s=679c9df194127816f03002feb58a8159c88a012a)
|
||||
|
||||
To the Moon!
|
||||
|
||||
I did the same process of scatter and fitting curve this time with the exponential:
|
||||
|
||||
[](https://preview.redd.it/m9sioly1nh471.png?width=903&format=png&auto=webp&s=18f5889fcf4610d3c84b4de88f05dc9d1cc370de)
|
||||
|
||||
Ape Curve
|
||||
|
||||
Also, not sure if there's anything here, but the number 0.8 or 80 percent stood out to me. Need more wrinkled feedback.
|
||||
|
||||
-----------------------------------------------------------------------------------------------------------------------------------------------------
|
||||
|
||||
E. Impossible to Short to Zero
|
||||
|
||||
I can use the same process as earlier to find the amount of shares needed to short the ape curve close to zero:
|
||||
|
||||
[](https://preview.redd.it/58fozggdnh471.png?width=989&format=png&auto=webp&s=69af8afc934a8c1bd51b42578ddf226dbc6acf52)
|
||||
|
||||
Shares Needed to Zero
|
||||
|
||||
These expressions violate our curve rules from earlier. All elements cannot be negative.
|
||||
|
||||
[](https://preview.redd.it/1ctkekv0oh471.png?width=938&format=png&auto=webp&s=9c66d9b4480d5a16c79b715e709d08516d654862)
|
||||
|
||||
Da Rules
|
||||
|
||||
This seems to imply that if apes continue to BUY & HODL the price cannot go to zero. It is mathematically impossible.
|
||||
|
||||
*Negative Volume*
|
||||
|
||||
This is a connection I just made today, so I'll have to shoehorn it in here.
|
||||
|
||||
For the last several months, negative volume will show up in the data feeds for various apes. [This](https://www.reddit.com/r/Superstonk/comments/nwta9j/what_is_this_fuckery_can_anyone_explain_a/) is the most recent incident.
|
||||
|
||||
Now Dave Lauer did say that those were most likely end of the day rebalancing and whatnot, so I'm not suggesting anything tin foil-y.
|
||||
|
||||
My hypothesis is simply that the negative candle is the manifestation of the algo doing something based on these curves. I don't know the algo is doing and I don't know if it is nefarious or not. I def need wrinkle brain feedback here.
|
||||
|
||||
-----------------------------------------------------------------------------------------------------------------------------------------------------
|
||||
|
||||
F. The Final Volume
|
||||
|
||||
The final volume will be the shortest, but the juiciest. Based on what we've discussed, there may be a way to calculate how many shorted shares there are and find out the true short interest.
|
||||
|
||||
-----------------------------------------------------------------------------------------------------------------------------------------------------
|
||||
|
||||
TL:DR -> At this point, the number of shares needed to short $GME to zero does not mathematically exist.
|
||||
|
||||
TA:DR -> $GME only go up! Math say so!
|
||||
|
||||
--------------------------------------------------------------------------------------------------------------------------------------------------------
|
||||
|
||||
This post brought to you on behalf of Margery Nesbitt. Help her find Kenny, he isn't taking her calls for some reason...
|
||||
@ -0,0 +1,124 @@
|
||||
Math Black Magic Vol. 3: Trillion Short Share Seance
|
||||
====================================================
|
||||
|
||||
| Author | Source |
|
||||
| :-------------: |:-------------:|
|
||||
| [u/nydus_erdos](https://www.reddit.com/user/nydus_erdos/) | [Reddit](https://www.reddit.com/r/Superstonk/comments/nya5ps/math_black_magic_vol_3_trillion_short_share_seance/) |
|
||||
|
||||
---
|
||||
|
||||
[DD 👨🔬](https://www.reddit.com/r/Superstonk/search?q=flair_name%3A%22DD%20%F0%9F%91%A8%E2%80%8D%F0%9F%94%AC%22&restrict_sr=1)
|
||||
|
||||
DISCLAIMER: Third part of my first DD. Not financial advice. All credit to the authors of referenced works.
|
||||
|
||||
--------------------------------------------------------------------------------------------------------------------------------------------------------
|
||||
|
||||
ACKNOWLEDGEMENTS:
|
||||
|
||||
I'll also be using equations from [u/JTH1](https://www.reddit.com/u/JTH1/)'s (aka "exponential floor guy") works.
|
||||
|
||||
--------------------------------------------------------------------------------------------------------------------------------------------------------
|
||||
|
||||
A. Quick Review
|
||||
|
||||
In [Volume 1](https://www.reddit.com/r/Superstonk/comments/nw8281/math_black_magic_vol_1_why_it_is_mathematically/), I break down an academic finance paper by John Finnerty. In it, he mathematically proves that it's impossible to short a stock to zero without naked shorting AT LEAST as many shares as there are outstanding, doubling the float in the process.
|
||||
|
||||
In [Volume 2](https://www.reddit.com/r/Superstonk/comments/nwy0oz/math_black_magic_vol_2_the_limit_does_not_exist/), I lay out how I think apes fucked up hedgies' algos initially, make conjecture on rates of change in our exponential graphs and show (through Finnerty's theories) that, at this point, the number of shares needed to short $GME to zero does not mathematically exist.
|
||||
|
||||
--------------------------------------------------------------------------------------------------------------------------------------------------------
|
||||
|
||||
B. Goal of This Volume
|
||||
|
||||
So far we an equations that relate *P(t) to Q*
|
||||
|
||||
[](https://preview.redd.it/sbv13sumfu471.png?width=648&format=png&auto=webp&s=63e2d69f476bb6add74ff9a5081c3e681283356f)
|
||||
|
||||
Demand Curves
|
||||
|
||||
And equations that relate *P(t)* to *t*
|
||||
|
||||
[](https://preview.redd.it/j2vdkh7cgu471.png?width=521&format=png&auto=webp&s=f27f8d220bb288937c388e6d32e89f861d82401b)
|
||||
|
||||
Thanks to Exponential Floor Guy
|
||||
|
||||
My goal is to find an equation that can relate Q and t. That equation can possibly be used to find the real short interest.
|
||||
|
||||
--------------------------------------------------------------------------------------------------------------------------------------------------------
|
||||
|
||||
C. Hedgies' Curves
|
||||
|
||||
*Case 1*
|
||||
|
||||
The hedgies' curves are the second equation in each list. First, I tried setting them equal to each other:
|
||||
|
||||
[](https://preview.redd.it/8xr7dbtuiu471.png?width=1289&format=png&auto=webp&s=7ae5032792440214363242a29e88f9d59d687833)
|
||||
|
||||
No new information here
|
||||
|
||||
But, this doesn't really help me cause of I don't know *B*, so ~~I tried a little calculus~~ ~~did a little simple calculus~~ I had a math séance. Cover your eyes and skip to the next section if math horrifies you. I will begin the ritual with the traditional chant *ahem*
|
||||
|
||||
[](https://preview.redd.it/76u4fk2aku471.png?width=1048&format=png&auto=webp&s=207ca8ca3213db1948f54ce3883639064350a637)
|
||||
|
||||
Yu Mo Gui Gwai Fai Di Zao, Yu Mo Gui Gwai Fai Di Zao, Yu Mo Gui Gwai Fai Di Zao...
|
||||
|
||||
EDIT: I made a mistake in notation, the derivative of the linear equation should be taken with respect to Q (d/dQ). This will not change the answer as P(t) = D(Q)
|
||||
|
||||
Now that we've completed the ritual and the dark gods have gifted us an equation lets plot that bad boy and find the amount of shares:
|
||||
|
||||
[](https://preview.redd.it/co6mjaatlu471.png?width=952&format=png&auto=webp&s=1ef2e94f1ab30e25e3c5e1366ee1033573f589d2)
|
||||
|
||||
[](https://preview.redd.it/kiy1tob5nu471.png?width=974&format=png&auto=webp&s=fe08f2b2eebc2644acc7fd9d3868624224bdb58b)
|
||||
|
||||
1.4 TRILLION SHARES
|
||||
|
||||
*Case 2*
|
||||
|
||||
For such a huge number, I figured I should try the calculation again with a value of 40 dollars and see what I got:
|
||||
|
||||
[](https://preview.redd.it/b5bnuvhcou471.png?width=852&format=png&auto=webp&s=12a2acbd89881b3770b72f34efb9f842816bb6e7)
|
||||
|
||||
[](https://preview.redd.it/1sqnpp1gou471.png?width=934&format=png&auto=webp&s=f4d7b7039e64470915de0b656377fc3055f4a75d)
|
||||
|
||||
[](https://preview.redd.it/9wyb54dmou471.png?width=973&format=png&auto=webp&s=8c8b8016ce118d76979b89215db3a0ebb8fafe66)
|
||||
|
||||
116 BILLION SHARES
|
||||
|
||||
--------------------------------------------------------------------------------------------------------------------------------------------------------
|
||||
|
||||
D. Ape's Curves
|
||||
|
||||
I will now perform part two of the math séance, by repeating the process above for the ape curve:
|
||||
|
||||
[](https://preview.redd.it/ukba2075pu471.png?width=1007&format=png&auto=webp&s=d0f81c578fb481cab287a3fb4846cf9326f6062c)
|
||||
|
||||
[](https://preview.redd.it/fitnd4a8pu471.png?width=1036&format=png&auto=webp&s=47b616777fedf483dc2004b9108e6457b32e1cfc)
|
||||
|
||||
I Implore the Spirit of Isaac Newton, Aid Me In My Dark Deed...
|
||||
|
||||
Now this is what things get VERY interesting, check out that asymptote:
|
||||
|
||||
[](https://preview.redd.it/xdb6gd56qu471.png?width=871&format=png&auto=webp&s=6f34aa774b64c4ddbf0bc0b3161142ef0fe9ed36)
|
||||
|
||||
[](https://preview.redd.it/59673f2aqu471.png?width=1025&format=png&auto=webp&s=af9d1952760e62ad7324eb3ac0551141188dc258)
|
||||
|
||||
837 MILLION SHARES
|
||||
|
||||
I'm not sure what the asymptote implies or represents, but I feel that its significant.
|
||||
|
||||
--------------------------------------------------------------------------------------------------------------------------------------------------------
|
||||
|
||||
E. Conclusion
|
||||
|
||||
Thanks for coming to my APE Talk. Constructive criticism is always welcome!
|
||||
|
||||
TL:DR -> Hedgies have naked shorted, at most, about 1.4 trillion shares and, at least, about 837 million shares.
|
||||
|
||||
TA:DR -> Hedgies have pissed off math gods. Hedgies r fuk.
|
||||
|
||||
--------------------------------------------------------------------------------------------------------------------------------------------------------
|
||||
|
||||
F. Questions I Could Use Help With
|
||||
|
||||
- What does that asymptote represent? Is this when it no longer becomes possible for hedgies to dilute the float meaningfully? Is this the stalemate that occurs when the shares are being bought at higher rate?
|
||||
|
||||
- Have I calculated how many shares have been naked shorted or how many shares retail holds? The way Finnerty frames it, I believe the shares I calculate are the amount of shares naked shorted. However, the demand curve equation says it describes how many shares retail investors hold. I think it can describe both, but I'm sure what context the results of my calculations are in.
|
||||
@ -0,0 +1,68 @@
|
||||
Math Black Magic, Final Vol: Epilogue
|
||||
=====================================
|
||||
|
||||
| Author | Source |
|
||||
| :-------------: |:-------------:|
|
||||
| [u/nydus_erdos](https://www.reddit.com/user/nydus_erdos/) | [Reddit](https://www.reddit.com/r/Superstonk/comments/odrnbv/math_black_magic_final_vol_epilogue/) |
|
||||
|
||||
---
|
||||
|
||||
[DD 👨🔬](https://www.reddit.com/r/Superstonk/search?q=flair_name%3A%22DD%20%F0%9F%91%A8%E2%80%8D%F0%9F%94%AC%22&restrict_sr=1)
|
||||
|
||||
Not financial advice. All credit to the authors of cited works
|
||||
|
||||
THE PREVIOUS VOLUMES ARE ESSENTIAL TO UNDERSTANDING THIS POST: [Vol. 1](https://www.reddit.com/r/Superstonk/comments/nw8281/math_black_magic_vol_1_why_it_is_mathematically/), [Vol. 2](https://www.reddit.com/r/Superstonk/comments/nwy0oz/math_black_magic_vol_2_the_limit_does_not_exist/), [Vol. 3](https://www.reddit.com/r/Superstonk/comments/nya5ps/math_black_magic_vol_3_trillion_short_share_seance/)
|
||||
|
||||
----------------------------------------------------------------------------------------------------------------------------------------------------
|
||||
|
||||
1\. Quick Recap
|
||||
|
||||
In 2005, finance professor John Finnerty published a paper entitled: [Short Selling, Death Spiral Convertibles and the Profitability of Stock Manipulation](https://www.sec.gov/comments/s7-08-08/s70808-318.pdf). Using math and game theory he presents a model depicting a manipulated market. I covered the paper extensively in Vol. 1 and applied some of the concepts in Vol. 2 and 3 to try to estimate the total number of shares shorted. I stand by my methods, but they needed refinement. I reworked some things and I feel much more confident about my results here.
|
||||
|
||||
----------------------------------------------------------------------------------------------------------------------------------------------------
|
||||
|
||||
2\. Method
|
||||
|
||||
My methods are pretty much the same as last time, so this post will be relatively short and not so many graphs or derivations. There are nuances, but I'm saving most of them for the next series since they require a lot of background knowledge. If there's something that seems like I didn't explain fully, it'll be covered extensively later.
|
||||
|
||||
Using the pattern laid out earlier, I analyzed the largest drops I could find before the Sneeze, during the Sneeze, and after. I used Finnerty's formulas to calculate quantity of shares shorted and combined them with price data. Using data processing software, I ran several scenarios, based on Finnerty's model and choose the lowest reasonable answer based on past behavior and revealed data. Using all this I found cumulative SI.
|
||||
|
||||
I did not have an explicit control, however now that we have some idea of the real short interest stated in the recent Robinhood document, I used that data to calibrate the model. I also used an example referenced in the paper regarding a company called Charter Communications:
|
||||
|
||||
> "The NASD reported that Charter had short interest of 88,520,000 shares inJanuary 2005, but Charter reported having a float of only 36,600,000 shares."Pg. 45, footnote 66
|
||||
|
||||
That's about 2.4 times the float. I tried to find more info about Charter, but it seems like its hard to get any info about stocks pre-2010. Anyway, it gave me some reference point of what a highly shorted stock (at that point) looked like.
|
||||
|
||||
This model only goes from 10/30/15 to 4/12/2021. Past there I couldn't find any meaningful large drops. Since this model is still general, complexity is the enemy at this point. Future projects involve refining the model with more complexity in mind. Until then, I wouldn't feel confident in any answer I got from a smaller drop.
|
||||
|
||||
----------------------------------------------------------------------------------------------------------------------------------------------------
|
||||
|
||||
3\. Refined Results
|
||||
|
||||
As of 4/12/2021:
|
||||
|
||||
- Shitadel and Co. had cumulatively shorted approximately 3 billion shares
|
||||
|
||||
- The short interest was about 4,302 percent. That's 43 times shares outstanding.
|
||||
|
||||
- At current average daily volume (~7.6 million) that's 400 days to cover, which amounts to 1.6 trading years.
|
||||
|
||||
----------------------------------------------------------------------------------------------------------------------------------------------------
|
||||
|
||||
4\. What's Next
|
||||
|
||||
My next series will be titled *The Chronicles of Short and Shorter*. In order to write it I had to gain a deeper understanding of the concepts we've used. This led me to the most intense knowledge binge of my adult life: microeconomics. Holy fuck. What a blessed rabbit hole. This is the subject that's pretty much the basis for everything Finnerty wrote. As I am a veryyy autistic ape, it never occurred to me to try to find what the field was called. It allowed to me to take some of Finnerty's concepts further and answer some more questions. So, over the next series we'll:
|
||||
|
||||
- Go over some economic concepts
|
||||
|
||||
- Dissect Shitadel and Co.'s strategy and patterns of attack in the pre-Sneeze period, during the Sneeze and post-Sneeze period.
|
||||
|
||||
- Estimate Shitadel and Co.'s cost function
|
||||
|
||||
- Give my idea on what exponential floor guy's findings might be caused by
|
||||
|
||||
----------------------------------------------------------------------------------------------------------------------------------------------------
|
||||
|
||||
TL;DR ==> See section 3.
|
||||
|
||||
TA;DR ==> Math gods are still pissed at hedgies. Hedgies r still fuk.
|
||||
@ -0,0 +1,157 @@
|
||||
Malleus Oeconomica: A Compressed Primer
|
||||
=======================================
|
||||
|
||||
| Author | Source |
|
||||
| :-------------: |:-------------:|
|
||||
| [u/nydus_erdos](https://www.reddit.com/user/nydus_erdos/) | [Reddit](https://www.reddit.com/r/Superstonk/comments/of1lz2/malleus_oeconomica_a_compressed_primer/) |
|
||||
|
||||
---
|
||||
|
||||
|
||||
[DD 👨🔬](https://www.reddit.com/r/Superstonk/search?q=flair_name%3A%22DD%20%F0%9F%91%A8%E2%80%8D%F0%9F%94%AC%22&restrict_sr=1)
|
||||
|
||||
Not financial advice.
|
||||
|
||||
Previous Volumes below. If something seems unclear, the answer is probably in here:
|
||||
|
||||
[Vol. 1](https://www.reddit.com/r/Superstonk/comments/nw8281/math_black_magic_vol_1_why_it_is_mathematically/), [Vol. 2](https://www.reddit.com/r/Superstonk/comments/nwy0oz/math_black_magic_vol_2_the_limit_does_not_exist/), [Vol. 3](https://www.reddit.com/r/Superstonk/comments/nya5ps/math_black_magic_vol_3_trillion_short_share_seance/), [Epilogue](https://www.reddit.com/r/Superstonk/comments/odrnbv/math_black_magic_final_vol_epilogue/)
|
||||
|
||||
Main Sources: [Finnerty Paper](https://www.sec.gov/comments/s7-08-08/s70808-318.pdf), [Microeconomics 7th Edition by Jeffrey M. Perloff](http://dl.rasabourse.com/MIT.Mircroeconomics.Jeffrey%20M.%20Perloff%20-%20Microeconomics%20(2014,%20Pearson).pdf)
|
||||
|
||||
-----------------------------------------------------------------------------------------------
|
||||
|
||||
0\. Clarification
|
||||
|
||||
In my last post I was a little unclear about what my numbers describe. They represent the total amount of shares ever shorted. I can't speak to whether these shares were covered or what their status is now. The model is quite simple at the moment and needs further developing. I plan to integrate more variables as time goes on and get more precision.
|
||||
|
||||
-----------------------------------------------------------------------------------------------
|
||||
|
||||
1\. Purpose
|
||||
|
||||
The ultimate reason for this primer is twofold. First, I want to give the background of the concepts I'll be referencing heavily in future works. Second, is to show how crazy this situation appears to be in terms of economics. The market that Kenny and Co. have created seems to be an anomaly. In order to show how abnormal what they've created is, I have to give you some idea on what the norm is and is not.
|
||||
|
||||
-----------------------------------------------------------------------------------------------
|
||||
|
||||
2\. Supply & Demand
|
||||
|
||||
- Most important thing regarding this topic, I thought that quantity supplied or demanded determines price, however its actually the other way around: Price determines quantity supplied or demanded.
|
||||
|
||||
- Law of Demand says that as price increases, quantity demanded decreases. In normal cases, this is because once the good becomes too expensive, people will find a cheaper alternative.
|
||||
|
||||
- Law of Supply says that as price increases, quantity supplied increases. This is because if an item is selling for a high price, producers have incentive to produce more.
|
||||
|
||||
- Another important point, in a perfectly competitive market quantity demanded =/= quantity supplied. This is why we have surpluses or shortages.
|
||||
|
||||
-----------------------------------------------------------------------------------------------
|
||||
|
||||
3\. Important terms
|
||||
|
||||
A mathematical function expresses the relationship between the independent variable and dependent variable. It is usually denoted in the general form f(x). In a specific form, f and x can be any variable.
|
||||
|
||||
- A monopoly is the only supplier of a good that has no close substitute
|
||||
|
||||
- A firm's marginal cost or marginal revenue is the amount by which a firm's total cost or revenue changes if the firm produces one more unit of output.
|
||||
|
||||
- The law of diminishing marginal returns holds that if a firm keeps increasing an input, holding all other inputs constant, the corresponding increases in output will become smaller eventually. In ape, marginal revenue diminishes past a certain quantity sold. Diminishing marginal returns determines the shape of the marginal cost curve.
|
||||
|
||||
-----------------------------------------------------------------------------------------------
|
||||
|
||||
4\. Variable Descriptions
|
||||
|
||||
[](https://preview.redd.it/ti2pyq57sm971.png?width=612&format=png&auto=webp&s=9f78fc7c270555c3b2ad2659b41f4daeb0cacacd)
|
||||
|
||||
Variables
|
||||
|
||||
-----------------------------------------------------------------------------------------------
|
||||
|
||||
5\. Supply and Demand Curves
|
||||
|
||||
When speaking about any type of supply and demand curves, the variables on the axes are price and quantity, and they are usually expressed linearly. In reality, supply and demand curves do not have to be linear and come in non-linear forms. However, economists try to express them linearly whenever they can for simplicity sake. The most important thing to note here is that in supply and demand functions, price is the independent variable and quantity is the dependent variable or *Q(P)*. This means that *Q* should be on the y-axis and *P* should be on the x-axis. I won't be going into these functions in depth just yet.
|
||||
|
||||
-----------------------------------------------------------------------------------------------
|
||||
|
||||
6\. Inverse Supply and Demand Curves
|
||||
|
||||
Why am I going through inverse curves first? Because in economics they break some mathematical conventions we take for granted, which makes things admittedly very confusing. First thing, economists are extremely kinky when it comes to the axes of their charts For example:
|
||||
|
||||
> "It is the convention in economics to always display a demand and supply curve with amount Q on the x-axis and price P on the y-axis. Thus, technically speaking, when we sketch the demand curve we are really sketching the inverse demand curve because Q is the independent variable and P is the dependent variable. In order to sketch the demand and supply curves, we must first therefore rearrange to make P the subject of the expression." ([Pg. 1-2](https://users.ox.ac.uk/~sedm1375/Teaching/Micro/week4.pdf))
|
||||
|
||||
Wat? That's literally what I said after reading it for the 30th time, but after much more research here's my short answer: economists prefer to always have price, the independent variable, on the y-axis as it makes it easier to interpret the charts (for them). To which the math gods say: 'You can call it whatever you want, but if its on the y-axis it is the dependent variable and if its on the x-axis its the independent variable.' To which the economists said,
|
||||
|
||||
[](https://preview.redd.it/rgx5mp5cum971.png?width=573&format=png&auto=webp&s=e7b3b1c61b1fbd6f71f25253961a26263351ed61)
|
||||
|
||||
Verse 23
|
||||
|
||||
Anyway, apparently its common for economists to express supply/demand curves in their inverse form. Here is the general inverse form:
|
||||
|
||||
[](https://preview.redd.it/j3gb83m6vm971.png?width=323&format=png&auto=webp&s=fdf68c7fae68086d3b3307183fe8a2e0089d53be)
|
||||
|
||||
Inverse Demand Function
|
||||
|
||||
This should look familiar as this is the curve Finnerty uses in his paper. Apparently, it is common to express demand curves in their inverse forms.
|
||||
|
||||
-----------------------------------------------------------------------------------------------
|
||||
|
||||
7\. Regular Supply and Demand Curves
|
||||
|
||||
So how do we find the regular demand curve? Turns out we already did it in the previous volumes. Here it is again with one additional tweak:
|
||||
|
||||
[](https://preview.redd.it/ddocvf3jvm971.png?width=948&format=png&auto=webp&s=122e9304f7218810d1023abba31c6eb07896bd77)
|
||||
|
||||
Demand Function
|
||||
|
||||
-----------------------------------------------------------------------------------------------
|
||||
|
||||
8\. Slope vs. Elasticity
|
||||
|
||||
More confusing concepts incoming: Within microeconomics, elasticity and slope are always regarded as a pair of two closely related concepts, but are not the same. Slope is the change of the dependent variable per the change of the independent variable. Elasticity is the percentage change in a variable in response to a given percentage change in another variable. (Quick side note: turns out [elasticity is also a concept studied in pure mathematics as well](https://en.wikipedia.org/wiki/Elasticity_of_a_function)). One of the results of using this convention is that linear demand/supply curves have a constant slope, but not constant elasticity. Why all this tomfoolery? Because elasticity is unitless (i.e. normalized), so we don't have to worry about different units. Here are the equations and their equivalents:
|
||||
|
||||
[](https://preview.redd.it/elpqvldxvm971.png?width=644&format=png&auto=webp&s=fd8a734c163099eac93b72d6dcd0ddee1b369c9b)
|
||||
|
||||
Elasticity
|
||||
|
||||
I'll give you a hypothetical and a real world example of why this is useful:
|
||||
|
||||
- Say, hypothetically, there an ape outside the US doing the same calculations I am. Since we are using different currency, we would not get the same answers unless we normalized our answers first.
|
||||
|
||||
- IRL, one of the things I struggled with in this project is I would get reasonable answers but they would always be off by a decimal place or two. Once I normalized, the slope those problems went away. Because I was moving between tens of dollars/shares, to hundreds of dollars/share, all the way up to billions of dollars/shares. Its no wonder why the decimal point got all jostled around.
|
||||
|
||||
-----------------------------------------------------------------------------------------------
|
||||
|
||||
9\. Types of Elasticity
|
||||
|
||||
'Member talking about how elasticity is different along a demand/supply curve. Well the curve itself? Well, we can basically divide the curve up into three parts:
|
||||
|
||||
1. At the midpoint of the linear demand curve is called unitary (unit) elastic and is equal to -1. Here a one percent increase in price causes a one percent fall in quantity. I interpret this point to be similar to average elasticity of the curve.
|
||||
|
||||
2. For quantities between the midpoint of the linear demand curve and the lower end, the elasticity is between 0 and -1 and is inelastic. Where the demand curve is inelastic, a one percent increase in price leads to a fall in quantity of less than one percent.
|
||||
|
||||
3. For quantities between the midpoint of the linear demand curve and the upper end, the elasticity is less than -1 and is elastic. Here a one percent increase in price causes quantity to fall by more than one percent.
|
||||
|
||||
[](https://preview.redd.it/rn13yfkpwm971.png?width=1162&format=png&auto=webp&s=78904f435be146a8a0459e1a5c3247fdaeacf352)
|
||||
|
||||
Elasticity Along Curve
|
||||
|
||||
-----------------------------------------------------------------------------------------------
|
||||
|
||||
10\. Monopoly Market Structure
|
||||
|
||||
- A monopoly's profit is maximized in the elastic portion of the demand curve.
|
||||
|
||||
- The monopolist is able to set a price above marginal cost without losing all of their sales. This means its demand curve slopes downward, which is not the case in a perfectly competitive market.
|
||||
|
||||
- Since the monopolist has market control, the firm can set the market price or set how much they decide to produce. In the textbook, they usually assume the monopoly chooses to set quantity. We'll do the same as well.
|
||||
|
||||
- Unlike a competitive firm, a monopoly does not have a supply curve.
|
||||
|
||||
- The lack of a supply curve makes a monopoly's output decision dependent on the shapes of its marginal cost curve and its demand curve. In a competitive market, a firm is only constrained by the shape of the marginal cost curve.
|
||||
|
||||
-----------------------------------------------------------------------------------------------
|
||||
|
||||
11\. Coming Next
|
||||
|
||||
Now that there's finally some background knowledge, we can start getting to the refined model and how I got my numbers
|
||||
|
||||
-----------------------------------------------------------------------------------------------
|
||||
|
||||
TL:DR => Honestly, I don't know how to compress it anymore
|
||||
@ -0,0 +1,48 @@
|
||||
Peek-a-boo! I see you 79M hidden shorts!
|
||||
========================================
|
||||
|
||||
| Author | Source |
|
||||
| :-------------: |:-------------:|
|
||||
| [u/WhatCanIMakeToday](https://www.reddit.com/user/WhatCanIMakeToday/) | [Reddit](https://www.reddit.com/r/Superstonk/comments/odsded/peekaboo_i_see_you_79m_hidden_shorts/) |
|
||||
|
||||
---
|
||||
|
||||
[DD 👨🔬](https://www.reddit.com/r/Superstonk/search?q=flair_name%3A%22DD%20%F0%9F%91%A8%E2%80%8D%F0%9F%94%AC%22&restrict_sr=1)
|
||||
|
||||
tl;dr: I found around 79M can kicked shares in Jan 2021 using the married put approach. We can see those cans kicked out 1, 2, 3, 6, 12, and 24 months from Jan 2021 at various options expirations.
|
||||
|
||||
After poking around in ToS, I found that I can see exactly when Puts where opened by tracking the daily Open Interest for a put. See my previous post here: <https://www.reddit.com/r/Superstonk/comments/ocen11/historical_gme_71421_options_oi_to_see_how_many/>
|
||||
|
||||
I needed the data in CSV format so I could play with it. So I bought the GME Options Data (surprisingly cheap, about $21) from <https://www.historicaloptiondata.com/> for 2021 up to end of June.
|
||||
|
||||
I then filtered out the lowest strike Put option for each of the major options expirations (Feb, March, April, Jan 2022 leap, and Jan 2023 leap) during that time and charted the daily Open Interest Change.
|
||||
|
||||
[Daily OI Change for Lowest Strike Puts](https://preview.redd.it/mfk5o6z1r8971.png?width=1097&format=png&auto=webp&s=26b7024d5072bbb0683b9d9c1a3d34e596ddfa4e)
|
||||
|
||||
Guess what? Most of these low strike puts were opened around GME's Jan run up!
|
||||
|
||||
*Wut mean?* Superstonk has been discussing how married puts are used to hide naked shorts in deep OTM puts so this data shows us exactly how far out they kicked those Jan naked short cans down the road AND we can see which expirations have them. We can see pretty much every major options expiration has a ton of new openings in Jan so those cans were kicked 1, 2, 3, 6, 12, and 24 months out (Feb ,March, April, July, Jan 2022, and Jan 2023, respectively).
|
||||
|
||||
| *Option* | *As of 1/4/2021* | *As of 2/1/2021* |
|
||||
| --- | --- | --- |
|
||||
| Feb $1 Put | 0 | 52,193 |
|
||||
| March | 0 (n/a) | 32,907 |
|
||||
| April $0.50 Put | 510 | 43,892 |
|
||||
| July $0.50 Put | 168 | 71,709 |
|
||||
| Jan 2022 $0.50 Put | 2,441 | 106,082 |
|
||||
| Jan 2023 $2 Put | 105 | 16,585 |
|
||||
| Total | 3,224 | 323,368 |
|
||||
|
||||
*Do you see what I see?* There's about 320,000 options opened in Jan 2021 to hide naked shorts and kick those cans *just at the cheapest strike!* That's the equivalent of 32,000,000 (32M) shares!
|
||||
|
||||
*Wut about other low strikes?* I filtered the options data for two snapshots in time: Jan 4, 2021 (before can kicking) and Feb 1, 2021 (after can kicking). Out of those snapshots, I summed the total open interest for all options with a strike price less than or equal to $20. Here's the results:
|
||||
|
||||
| | 1/4/2021 | 2/1/2021 |
|
||||
| --- | --- | --- |
|
||||
| Total Put OI for all strikes <= $20 | 309,563 | 1,101,826 |
|
||||
|
||||
The difference there is 792,263 OI. Basically just shy of 800k new put open interest at super low OTM strikes representing over 79M shares kicked down the road in Jan 2021! Half of those are hidden in the lowest strike alone.
|
||||
|
||||
Happy July 4th! We're gonna have a blast!
|
||||
|
||||
EDIT: Wowza! Thanks everyone! I've never had this many upvotes or awards before! You are all amazing! I learned more in the past 6 months about trading and markets from Superstonk than in decades of trading. I'm happy I can give back to the community!
|
||||
@ -0,0 +1,45 @@
|
||||
Peek-a-boo! I see 103M hidden shorts! (Part Deux)
|
||||
=================================================
|
||||
|
||||
| Author | Source |
|
||||
| :-------------: |:-------------:|
|
||||
| [u/WhatCanIMakeToday](https://www.reddit.com/user/WhatCanIMakeToday/) | [Reddit](https://www.reddit.com/r/Superstonk/comments/oenvoh/peekaboo_i_see_103m_hidden_shorts_part_deux/) |
|
||||
|
||||
---
|
||||
|
||||
[DD 👨🔬](https://www.reddit.com/r/Superstonk/search?q=flair_name%3A%22DD%20%F0%9F%91%A8%E2%80%8D%F0%9F%94%AC%22&restrict_sr=1)
|
||||
|
||||
Part Uno (you might want to read it first for background): <https://www.reddit.com/r/Superstonk/comments/odsded/peekaboo_i_see_you_79m_hidden_shorts/>
|
||||
|
||||
I'm BAAACK!
|
||||
|
||||
After finding 79M hidden shorts in married puts, I asked myself "Can I do better?" I didn't disappoint. Don't get me wrong, I'm disappointed (yet also happy) that I found more shorts.
|
||||
|
||||
In Part Uno, I searched for new deep OTM Put Options that have no business being opened and found 79M shares worth of options (about 792k opened Put options) opened during the Jan GME spike. I used a rather crude approach which was assuming worthless options are at the deepest OTM Put strike and then expanded that to strikes <= $5. Crude, but it worked fairly well.
|
||||
|
||||
Here in Part Deux, I've improved on it by growing a wrinkle about options greeks.
|
||||
|
||||
Using the same GME Options Data set I bought for about $21 from <https://www.historicaloptiondata.com/> for 2021 up to end of June, I did the following:
|
||||
|
||||
1. Filtered the data set down to get two snapshots in time: Jan 19th, 2021 and Feb 1st, 2021. This is effectively bracketing the week before and week of the huge GME Jan spike. Whatever happens in here *should* 100% be tied to that crazy spike. (I just realized I'm undercounting a bit because the spike, T, was Jan 28th and Feb 1 is only T+2. I'm too lazy to rerun the process right now to expand out and you'll get the picture.)
|
||||
|
||||
2. Filtered out only for Puts (duh) because we're looking for Married Puts.
|
||||
|
||||
3. (NEW for Part Deux!) Filtered by *delta* which is an option greek that represents how much the option value changes per $1 change in the underlying stock price. I filtered for *delta* < 0.01 which means if the stock price moves by $1, the price of these options moves by a penny ($0.01) or less. These options are *literally* worthless.\
|
||||
Grow wrinkles about option greeks here: <https://www.investopedia.com/terms/g/greeks.asp>
|
||||
|
||||
4. Summed up the total Open Interest for all remaining Puts.
|
||||
|
||||
Total Open Interest for Puts with delta <= 0.01:
|
||||
|
||||
| As of Jan 19, 2021 | As of Feb 1, 2021 |
|
||||
| --- | --- |
|
||||
| 58,970 | 1,096,066 |
|
||||
|
||||
*Wut mean?* Over 1M worthless junk put options were opened in the 2 weeks (from Jan 19th to Feb 1st, 10 trading days) of our January spike. 1,037,096 worthless put options were opened. Sink that in because those brand spanking, newly opened, absolutely worthless options are capable of hiding over 103,700,000 (103M) shares.
|
||||
|
||||
Updates:
|
||||
|
||||
1. Why worthless puts? See <https://www.reddit.com/r/GME/comments/mgj0j1/the_naked_shorting_scam_revealed_lending_of/>
|
||||
|
||||
2. The prior 79M is a subset of this 103M. This approach is a more accurate way to count worthless options.
|
||||
@ -0,0 +1,47 @@
|
||||
Peek-A-Boo! I Track You Kicked Cans!
|
||||
====================================
|
||||
|
||||
| Author | Source |
|
||||
| :-------------: |:-------------:|
|
||||
| [u/WhatCanIMakeToday](https://www.reddit.com/user/WhatCanIMakeToday/) | [Reddit](https://www.reddit.com/r/Superstonk/comments/of1zn4/peekaboo_i_track_you_kicked_cans/) |
|
||||
|
||||
---
|
||||
|
||||
|
||||
[DD 👨🔬](https://www.reddit.com/r/Superstonk/search?q=flair_name%3A%22DD%20%F0%9F%91%A8%E2%80%8D%F0%9F%94%AC%22&restrict_sr=1)
|
||||
|
||||
If you've been following along with my posts, you'll know I track deep worthless OTM puts which SuperStonk has suspected of being used for married puts to defer FTDs. If you're new, you may want to catch up with my previous posts:
|
||||
|
||||
- [Historical GME 7/14/21 Options OI to see how many cans got kicked & how far](https://www.reddit.com/r/Superstonk/comments/ocen11/historical_gme_71421_options_oi_to_see_how_many/). This was my original post when I realized we can see exactly which day options are opened. And, by looking at which expiration, we can see how far cans get kicked.
|
||||
|
||||
- [Peek-a-boo! I see you 79M hidden shorts!](https://www.reddit.com/r/Superstonk/comments/odsded/peekaboo_i_see_you_79m_hidden_shorts/) is where I start tracking these suspected hidden shorts by focusing on new opens during GME's Jan spike.
|
||||
|
||||
- [Peek-a-boo! I see 103M hidden shorts! (Part Deux)](https://www.reddit.com/r/Superstonk/comments/oenvoh/peekaboo_i_see_103m_hidden_shorts_part_deux/) is where I learned to use delta to determine that a newly opened option is actually worthless which allows for a really good estimate of how many worthless options are opened to hide shorts during GME's Jan spike.
|
||||
|
||||
As we see those cans in Jan 2021 kicked down the road to various expirations, we're now going to see *where* those cans are kicked. We see many of those cans stacking up in the upcoming July options expiration so we'll start there.
|
||||
|
||||
I used the same GME Options data set from <https://www.historicaloptiondata.com/> for 2021 up to end of June (best $21 ever spent). I looked at the end of June (6/30) to find which July Put option has the most OI: July $0.50 Put with 148k OI. (The runner up is the $1 strike with 30k OI so I'm going to skip that for a cleaner chart.)
|
||||
|
||||
I extracted the daily open interest data for that July $0.50 Put and then calculated the new Open Interest for each day. This OI Change effectively shows you how many of those Puts were opened (or closed) that day. When we look at the July $0.50 Put line (blue), there's a noticeable spike in March.
|
||||
|
||||
So I did the same for the highest OI Jan 2022 leap puts (@ $0.50 strike) and the highest OI March 19 Puts (@ $1.00 strike). (Of course, for the options expiring March 19th, I had to get that data as of March 19th instead of June 30.) The second highest Jan 2022 leap put OI was the $1 strike with 29k OI and the second highest March 19 put OI was at the $10 strike with 37k OI. I'm setting these aside for now because you can see the trend with just the highest OI at the deepest OTM strike and this keeps the chart cleaner.
|
||||
|
||||
Have a nice chart:
|
||||
|
||||

|
||||
|
||||
[Put Open Interest Change per Day for March, July, and Jan 2022 Leap Options](https://preview.redd.it/u3armgxwrm971.png?width=1452&format=png&auto=webp&s=85e3e66ebf404f7c9f2b3f02ab870b6ba3f5ace3)
|
||||
|
||||
Here we can see lots of March 19th $1.00 Put options (green line) being opened in January at the "Oh Shit" moment and again in late February (presumably soon after the Feb options expired). This suggests the March expiration was used twice for can kicking from Jan and then again in Feb.
|
||||
|
||||
As the worthless March puts expired worthless in mid-March, you see a huge spike of new worthless July $0.50 P options (blue line) being opened up. Effectively, we're seeing cans that were kicked only a couple months out to March being kicked out again to July.
|
||||
|
||||
As July expiration comes up, we see 148k (@ the $0.50 strike) and 30k (@ the $1.00 strike) options expiring which is a solid 178k deep OTM puts almost certainly being used to hide about 17.8M shares just at those bottom two strikes. As of March 19, the deltas for all July option strikes below $13 have been 0 which means upwards of 273k worthless puts (probably hiding over 27M shares) are coming due. (As of March 19th, delta is under 0.01 up to around the $26 strike so many people would probably consider those to also be worthless. Why open worthless options positions?)
|
||||
|
||||
[ToS showing deltas for options as of March 19th](https://preview.redd.it/yl58wsuk6n971.png?width=5000&format=png&auto=webp&s=53537adfaf50a915e3f1022c0c7fa083d8cbbf8e)
|
||||
|
||||
With this analytical approach, we can see which future expirations those cans get kicked to. *And*, we can estimate the number of cans by summing up the new OI for options with delta < 0.01.
|
||||
|
||||
I'm looking forward to doing another analysis towards the end of July! Thanks for reading!
|
||||
|
||||
Edit: Fully spell out SuperStonk. Credit [u/b_h_w](https://www.reddit.com/u/b_h_w/)
|
||||
@ -0,0 +1,54 @@
|
||||
Google Consumer Survey Follow-Up: ***193.7 Million Shares Held By U.S. Retail Investors; N=700***
|
||||
=================================================================================================
|
||||
|
||||
[DD 👨🔬](https://www.reddit.com/r/Superstonk/search?q=flair_name%3A%22DD%20%F0%9F%91%A8%E2%80%8D%F0%9F%94%AC%22&restrict_sr=1)
|
||||
|
||||
Hello Everyone,
|
||||
|
||||
This pertains to $GME ownership among the U.S. adult population. If you'd like to know what this post is all about, please take a moment to hit up the original post below. It contains tons of info like methodology, links to result, surveys for other countries, research bias details, sample size calculators, other resources, and lots more:
|
||||
|
||||
<https://www.reddit.com/r/Superstonk/comments/o2cnd4/using_randomized_representative_surveying_data_to/?utm_source=share&utm_medium=web2x&context=3>
|
||||
|
||||
So ... my follow on survey completed over the weekend, providing another 400 samples for a total of 700. I haven't checked, but at 700 I imagine the margin of error is around 3%. That said, I just wanted to provide this quick update with this larger sample as I know folks were curious.
|
||||
|
||||
FYI, as this is a randomized sample from a massive pool of participants, combining these sample in such a way is totally kosher.
|
||||
|
||||
Here's how things shook out:
|
||||
|
||||
[](https://preview.redd.it/5i7269716p971.png?width=1706&format=png&auto=webp&s=7c956f8084d0b63281c9abc00128488b92593530)
|
||||
|
||||
**U.S. retail only. Doesn't include foreign retail, insiders, ETFs/mutual funds, institutional investors, family firms, hedge funds ... or those juicy open shorts.
|
||||
|
||||
~If I've made any math error in the above, I assure you it wasn't intentional, but I'd appreciate it if you could kindly point out my mistake so I can correct.~
|
||||
|
||||
I should mention that when I posted the initial results, someone reached out and said they started a survey to gather 1,500 samples. I reached out to this person a short while ago via PM, but haven't heard back yet. That said, since my 400 just recently completed, I imagine their 1,500 survey is still running strong. But I will update this post, should I hear back from them.
|
||||
|
||||
******If you have any questions or comments about sample size or methodology, I do ask that you please visit the OP first. Not on;y is there a ton of details in the post, there were also more than 600 comments on the thread with lots of great ideas, insights, suggestions, and just some very good discussion.******
|
||||
|
||||
Finally, this: None of what I am saying is financial advice, and I encourage everyone to do their own research when it comes to $GME, the stock market, and investing in general.
|
||||
|
||||
My personal advice: Never invest more than you can afford to lose. And as an aside ... if you have a guest in your home and they ask for some of your mayo, don't be a dick. Please share your mayo.
|
||||
|
||||
...............................
|
||||
|
||||
Edit #1: I guess I should post the survey result links here, huh? Sorry, there they are for anyone who wants to slice and dice the data:
|
||||
|
||||
Survey #1 (N=300): <https://surveys.google.com/reporting/question?hl=en-US&survey=sv2uhkuhypyl6olmiokx2zzkma&question=1&raw=true&transpose=false&tab=chart&synonyms=true>
|
||||
|
||||
Survey #2 (N=400): <https://surveys.google.com/reporting/question?hl=en-US&survey=gei6t23feekehqpuxr5woosr5a&question=1&raw=true&transpose=false&tab=chart&synonyms=true>
|
||||
|
||||
...............................
|
||||
|
||||
Edit #2: I heard back from the person who was running the 1,500 sample size, and it's almost complete (1,356/1,500). Below is a quick calc. of the current results, and the link to the survey for anyone who wants to play around and slice/dice the data. Google has a pretty good interface for breaking out demographics, etc.
|
||||
|
||||
So, without further ado ... this larger sample size results in:
|
||||
|
||||
Ownership: 5.6%
|
||||
|
||||
Avg. Shares: 32.5
|
||||
|
||||
As you can see, these results pretty closely align with the initial 700 sample (5.71% ownership and 39.5 share avg.) ... this larger sample size supports all the above results. The average share count has a little more flex than I'd like to see, but again, I've intentionally capped the count at 101 to guarantee a very conservative number here.
|
||||
|
||||
Here's a link to the survey (I'm not sure if the owner wants to be named, but I am asking ... if they are okay with that, I will update once I hear back):
|
||||
|
||||
<https://surveys.google.com/reporting/question?hl=en-US&survey=emu6442dcciv66jbwetrmxrea4&question=1&raw=true&transpose=false&tab=chart&synonyms=true>
|
||||
@ -0,0 +1,12 @@
|
||||
Reddit was raided by a targeted spam account campaign for 10 days starting Jan 15, and I can prove it. Some subs grew by over 6m new accounts during this time, while the default subs did not.
|
||||
===============================================================================================================================================================================================
|
||||
|
||||
| Author | Source |
|
||||
| :-------------: |:-------------:|
|
||||
| [u/go_do_that_thing](https://www.reddit.com/user/go_do_that_thing/) | [Reddit](https://www.reddit.com/r/Superstonk/comments/oes2su/reddit_was_raided_by_a_targeted_spam_account/) |
|
||||
|
||||
---
|
||||
|
||||
[Education 👨🏫 | Data 🔢](https://www.reddit.com/r/Superstonk/search?q=flair_name%3A%22Education%20%F0%9F%91%A8%E2%80%8D%F0%9F%8F%AB%20%7C%20Data%20%F0%9F%94%A2%22&restrict_sr=1)
|
||||
|
||||
[](https://i.redd.it/m1ztthjyhk971.png)
|
||||
@ -0,0 +1,21 @@
|
||||
Unlocked Institutional Holdings per 13F/NPORT filings Update: 7/6/21 (Source: Fintel.io)
|
||||
========================================================================================
|
||||
|
||||
| Author | Source |
|
||||
| :-------------: |:-------------:|
|
||||
| [u/d2blues](https://www.reddit.com/user/d2blues/) | [Reddit](https://www.reddit.com/r/Superstonk/comments/of7smj/unlocked_institutional_holdings_per_13fnport/) |
|
||||
|
||||
---
|
||||
|
||||
[Education 👨🏫 | Data 🔢](https://www.reddit.com/r/Superstonk/search?q=flair_name%3A%22Education%20%F0%9F%91%A8%E2%80%8D%F0%9F%8F%AB%20%7C%20Data%20%F0%9F%94%A2%22&restrict_sr=1)
|
||||
|
||||

|
||||
|
||||

|
||||
|
||||

|
||||
|
||||

|
||||
|
||||
|
||||
|
||||
@ -0,0 +1,11 @@
|
||||
### 🔴Daily Reverse Repo Update 07/06: $772.581B🔴
|
||||
|
||||
| Author | Source |
|
||||
| :-------------: |:-------------:|
|
||||
| [u/pctracer](https://www.reddit.com/user/pctracer/) | [Reddit](https://www.reddit.com/r/Superstonk/comments/oezg9l/daily_reverse_repo_update_0706_772581b/) |
|
||||
|
||||
---
|
||||
|
||||
[Education 👨🏫 | Data 🔢](https://www.reddit.com/r/Superstonk/?f=flair_name%3A%22Education%20%F0%9F%91%A8%E2%80%8D%F0%9F%8F%AB%20%7C%20Data%20%F0%9F%94%A2%22)
|
||||
|
||||

|
||||
@ -0,0 +1,154 @@
|
||||
Michael Burry, Jeremy Grantham, and other top investors are predicting an epic market crash. Here are their gravest warnings so far
|
||||
===================================================================================================================================
|
||||
|
||||
| Author | Source |
|
||||
| :-------------: |:-------------:|
|
||||
| [Theron Mohamed](https://www.businessinsider.com/author/theron-mohamed) | [businessinsider.com](https://www.businessinsider.com/michael-burry-jeremy-grantham-predict-epic-stock-market-crash-warnings-2021-7?amp) |
|
||||
|
||||
---
|
||||
|
||||

|
||||
|
||||
Michael Burry.
|
||||
|
||||
Jim Spellman / Getty Images
|
||||
|
||||
- Michael Burry, Jeremy Grantham, and other experts are predicting an epic market crash.
|
||||
- Jeffrey Gundlach, Leon Cooperman, and Stanley Druckenmiller expect a downturn too.
|
||||
- Here are the gravest warnings so far from eight top investors and commentators.
|
||||
- [See more stories on Insider's business page](https://www.businessinsider.com/?hprecirc-bullet).
|
||||
|
||||
Michael Burry and Jeremy Grantham are bracing for a devastating crash across financial markets. They're far from the only experts to warn that rampant speculation fueled by government-stimulus programs can't shore up asset prices forever.
|
||||
|
||||
Billionaire investors Leon Cooperman, Stanley Druckenmiller, and Jeffrey Gundlach have also sounded the alarm. The same is true for "Shark Tank" star Kevin O'Leary, market prophet Gary Shilling, and "Rich Dad Poor Dad" author Robert Kiyosaki.
|
||||
|
||||
Here are the most striking warnings from these eight market experts:
|
||||
--------------------------------------------------------------------
|
||||
|
||||
Michael Burry
|
||||
-------------
|
||||
|
||||

|
||||
|
||||
Michael Burry.
|
||||
|
||||
Getty Images/ Astrid Stawiarz
|
||||
|
||||
Michael Burry [described](https://www.businessinsider.com/big-short-michael-burry-twitter-return-biggest-market-bubble-ever-2021-6?amp) the state of markets in June as the "greatest speculative bubble of all time in all things," and [warned](https://markets.businessinsider.com/currencies/news/big-short-michael-burry-warns-meme-stocks-crypto-crash-coming-2021-6) that retail investors are buying into the hype around meme stocks and cryptocurrencies before the "mother of all crashes."
|
||||
|
||||
The investor of "The Big Short" fame, who runs Scion Asset Management, pointed to Tesla, GameStop, bitcoin, dogecoin, Robinhood, and the red-hot US housing market as signs of speculative excess earlier this year.
|
||||
|
||||
Jeremy Grantham
|
||||
---------------
|
||||
|
||||

|
||||
|
||||
Jeremy Grantham.
|
||||
|
||||
[Morningstar / YouTube](https://www.youtube.com/watch?v=Y95dg8tjQPc)
|
||||
|
||||
Jeremy Grantham [labeled](https://www.businessinsider.com/stock-market-outlook-indicators-lined-up-bubble-burst-jeremy-grantham-2021-5) the market a "fully fledged epic bubble" in January, and described it as the "real McCoy."
|
||||
|
||||
"When you have reached this level of obvious super-enthusiasm, the bubble has always, without exception, broken in the next few months, not a few years," the legendary investor and GMO cofounder continued.
|
||||
|
||||
"We will have to live, potentially, possibly, with the biggest loss of perceived value from assets that we have ever seen," Grantham added.
|
||||
|
||||
Leon Cooperman
|
||||
--------------
|
||||
|
||||

|
||||
|
||||
Leon Cooperman.
|
||||
|
||||
Jeff Zelevansky/Reuters
|
||||
|
||||
Leon Cooperman [expressed deep concerns](https://markets.businessinsider.com/news/stocks/leon-cooperman-blasts-stimulus-flags-bond-bubble-warns-market-crash-2021-5) about financial markets in May.
|
||||
|
||||
"Everything I look at would suggest caution, intermediate to long term, would be the rule of the day," the billionaire investor and Omega Advisors boss said. "When this market has a reason to go down, it's gonna go down so fast your head's gonna spin."
|
||||
|
||||
However, Cooperman described himself as a "fully invested bear" because that factors that typically cause bear markets --- rising inflation, [recession](https://www.businessinsider.com/what-is-a-recession) fears, a hostile [Federal Reserve](https://www.businessinsider.com/what-is-the-federal-reserve) --- weren't present.
|
||||
|
||||
Stanley Druckenmiller
|
||||
---------------------
|
||||
|
||||

|
||||
|
||||
Stanley Druckenmiller.
|
||||
|
||||
REUTERS/Brendan McDermid
|
||||
|
||||
Stanley Druckenmiller [said in May](https://markets.businessinsider.com/currencies/news/stanley-druckenmiller-blasted-fed-touted-bitcoin-ethereum-crypto-dollar-warning-2021-5) the current [bull market](https://www.businessinsider.com/what-is-a-bull-market) reminds him of the dot-com boom, but he cautioned that asset prices could continue rising for a while.
|
||||
|
||||
"I have no doubt that we are in a raging mania in all assets," the billionaire investor and Duquesne Family Office chief said. "I also have no doubt that I don't have a clue when that's gonna end."
|
||||
|
||||
"I knew we were in a raging mania in '99, but it kept going on, and if you had shorted the tech stocks in mid '99, you were out of business by the end of the year," Druckenmiller added.
|
||||
|
||||
However, the investor indicated he would pull his cash out of equities in a matter of months.
|
||||
|
||||
"I will be surprised if we're not out of the stock market by the end of the year, just because the bubbles can't last that long," he said.
|
||||
|
||||
Jeffrey Gundlach
|
||||
----------------
|
||||
|
||||

|
||||
|
||||
Jeffrey Gundlach.
|
||||
|
||||
REUTERS/Jessica Rinaldi
|
||||
|
||||
Equities are undeniably expensive, Jeffrey Gundlach [said in March](https://markets.businessinsider.com/news/stocks/billionaire-bond-king-jeffrey-gundlach-warns-stocks-overvalued-crash-coming-2021-3).
|
||||
|
||||
Claiming the stock market was "anything other than very overvalued versus history is just to be ignorant of all the metrics of valuation," the billionaire investor and DoubleLine Capital boss said. He warned that stocks would fall by upwards of 15% when the downturn comes.
|
||||
|
||||
Gundlach, whose nickname is the "bond king," predicted the retail investors that have piled into meme stocks and other speculative assets wouldn't stick around once prices started dropping.
|
||||
|
||||
"We'll have a tremendous unwind of a lot of the money that thinks that the stock market is a one-way thing," he said.
|
||||
|
||||
Kevin O'Leary
|
||||
-------------
|
||||
|
||||

|
||||
|
||||
Kevin O'Leary.
|
||||
|
||||
"Shark Tank"/ABC
|
||||
|
||||
Kevin O'Leary [warned](https://markets.businessinsider.com/currencies/news/shark-tank-kevin-oleary-gamestop-spacs-warns-stock-market-crash-2021-4) in April that stocks would eventually crumble, but he framed the downturn as an educational opportunity for rookie investors.
|
||||
|
||||
"Buying the dip is more rock and roll, but what invariably happens is you go through a massive correction and you learn a very important lesson," the "Shark Tank" star and O'Leary Funds chief said.
|
||||
|
||||
"The generation that is trading right now has never gone through a sustained correction. It's coming --- I don't know when, I don't know what'll trigger it, but they will learn their lesson," he continued.
|
||||
|
||||
If you have a lot of leverage on, it's a hell of a lesson because you end up in a negative net-worth position," O'Leary added. "But you do learn from it."
|
||||
|
||||
Robert Kiyosaki
|
||||
---------------
|
||||
|
||||

|
||||
|
||||
Robert Kiyosaki.
|
||||
|
||||
[The Rich Dad Channel/YouTube](https://www.youtube.com/watch?v=s7nO19BKNDA)
|
||||
|
||||
Robert Kiyosaki is [expecting the greatest market crash ever](https://markets.businessinsider.com/news/stocks/rich-poor-dad-robert-kiyosaki-market-crash-bitcoin-gold-silver-2021-6), the "Rich Dad Poor Dad" author [tweeted](https://twitter.com/theRealKiyosaki/status/1406063138995204098) in June.
|
||||
|
||||
"Biggest bubble in world history getting bigger," the personal-finance guru said. "Biggest crash in world history coming."
|
||||
|
||||
Kiyosaki has blamed the Federal Reserve for overstimulating markets and devaluing the dollar. He's advised investors to prepare for the downturn by stocking up on precious metals and cryptocurrencies.
|
||||
|
||||
"ARE YOU READY?" he [tweeted](https://twitter.com/theRealKiyosaki/status/1383256218882351115) in April. "Boom, Bust, Mania, Crash, Depression. Mania in markets today. Prepare for biggest crash, depression in world history. What will Fed do? Print more money? Save more gold, silver, bitcoin."
|
||||
|
||||
Gary Shilling
|
||||
-------------
|
||||
|
||||

|
||||
|
||||
Gary Shilling.
|
||||
|
||||
[Screenshot via Bloomberg TV](http://www.bloomberg.com/video/30-year-treasury-yield-to-fall-to-2-shilling-says-OyxH09A8RoOiSZHPXk3BMQ.html)
|
||||
|
||||
Gary Shilling [warned](https://markets.businessinsider.com/currencies/news/gary-shilling-stocks-crypto-market-crash-blasts-fed-warns-speculation-2021-4) in April that financial markets would nosedive, but he declined to hazard a guess at when the crash would arrive.
|
||||
|
||||
"I'm not making any firm prediction as to when this thing is going to collapse," the veteran forecaster and president of A. Gary Shilling & Co said.
|
||||
|
||||
"Speculations outrun any logic and that's probably going to be true of this one," Shilling continued. "But at some point, boy, there's going to be a lot of blood on the floor."
|
||||
@ -0,0 +1,51 @@
|
||||
Traders Pull $1.1 Billion From Real Estate ETF in Three Days
|
||||
============================================================
|
||||
|
||||
| Author | Source |
|
||||
| :-------------: |:-------------:|
|
||||
| [Claire Ballentine](https://www.bloomberg.com/authors/ATR8P7ZTClE/claire-ballentine) | [Bloomberg](https://www.bloomberg.com/markets/fixed-income) |
|
||||
|
||||
---
|
||||
|
||||
Exchange-traded investors are quickly backpedaling from the real estate sector after piling in at the fastest pace in at least seven years amid surging prices.
|
||||
|
||||
Investors yanked $544 million from BlackRock's [iShares U.S Real Estate ETF](https://www.bloomberg.com/quote/IYR:US "ETF Description") (IYR) on Friday, for a third straight day of outflows totaling $1.1 billion, according to data compiled by Bloomberg. The drawdowns reveal a quickly changing shift in sentiment toward a sector that's taken off as the economic recovery fuels demand for both commercial and residential properties.
|
||||
|
||||
That category of ETFs lured $3.8 billion in [June](https://www.bloomberg.com/news/articles/2021-06-25/billions-flood-into-real-estate-etfs-with-property-boom-raging "Billions Flood Into Real Estate ETFs With Property Boom Raging"), the biggest inflow since at least 2014. In the first two trading days of July, the funds have seen $456 million of withdrawals.
|
||||
|
||||
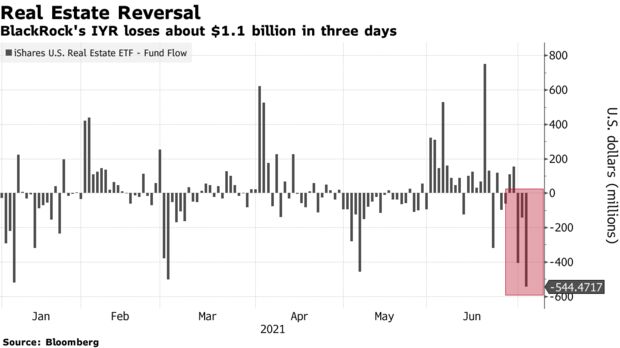
|
||||
|
||||
"The last real estate bust took place less than 20 years ago, so it's still in a lot of investors' minds," said Matt Maley, chief market strategist for Miller Tabak + Co. "Therefore, they're probably getting a little nervous after the huge run-up in the past 15 months."
|
||||
|
||||
The $6.4 billion BlackRock fund lost 0.5% last week. Still, it has risen more than 19% this year, compared to 16% for the S&P 500.
|
||||
|
||||
"There has been this surge in real estate, and the fact that's starting to come off reflects concerns about how interest rates could start to be moving higher," said Fiona Cincotta, senior financial markets analyst at City Index. "It's taken the shine off those areas of the market like real estate."
|
||||
|
||||
Following are the fund's biggest [holdings](https://www.bloomberg.com/quote/IYR:US "ETF Holdings") as of July 2:
|
||||
|
||||
| NAME | TICKER | POSITION | VALUE (USD) | CHANGE IN POSITION | % OF TOTAL ASSET VALUE |
|
||||
| :-------------: |:-------------:| :-------------: |:-------------:| :-------------: |:-------------:|
|
||||
| [American Tower Corp.](https://www.bloomberg.com/quote/AMT:US "All ETFs holding this security") | AMT US Equity | 2.1 million | 572.6 million | -178,610 | 9 |
|
||||
| [Prologis Inc.](https://www.bloomberg.com/quote/PLD:US "All ETFs holding this security") | PLD US Equity | 3.41 million | 413.2 million | -290,652 | 6.5 |
|
||||
| [Crown Castle International Cor](https://www.bloomberg.com/quote/CCI:US "All ETFs holding this security") | CCI US Equity | 1.99 million | 392.9 million | -169,812 | 6.1 |
|
||||
| [Equinix Inc.](https://www.bloomberg.com/quote/EQIX:US "All ETFs holding this security") | EQIX US Equity | 360,038 | 288.2 million | -30,634 | 4.5 |
|
||||
| [Public Storage](https://www.bloomberg.com/quote/PSA:US "All ETFs holding this security") | PSA US Equity | 708,993 | 214.6 million | -60,314 | 3.4 |
|
||||
| [Simon Property Group Inc.](https://www.bloomberg.com/quote/SPG:US "All ETFs holding this security") | SPG US Equity | 1.53 million | 198.3 million | -130,274 | 3.1 |
|
||||
| [Digital Realty Trust Inc.](https://www.bloomberg.com/quote/DLR:US "All ETFs holding this security") | DLR US Equity | 1.31 million | 197.1 million | -111,618 | 3.1 |
|
||||
| [Welltower Inc.](https://www.bloomberg.com/quote/WELL:US "All ETFs holding this security") | WELL US Equity | 1.94 million | 165.1 million | -165,572 | 2.6 |
|
||||
| [SBA Communications Corp.](https://www.bloomberg.com/quote/SBAC:US "All ETFs holding this security") | SBAC US Equity | 509,189 | 164.4 million | -43,354 | 2.6 |
|
||||
| [CoStar Group Inc.](https://www.bloomberg.com/quote/CSGP:US "All ETFs holding this security") | CSGP US Equity | 1.84 million | 151.9 million | -156,562 | 2.4 |
|
||||
|
||||
|
||||
These alerts are triggered for any U.S. exchange-traded fund that meets the following criteria (all numbers in US$). In some cases these updates may include portfolio rebalances:
|
||||
|
||||
| ASSETS UNDER MANAGEMENT | DAILY FLOW |
|
||||
| :-------------: |:-------------:|
|
||||
| >10bn | >1bn |
|
||||
| >1bn | >100m |
|
||||
| >500mln | >50m |
|
||||
| >250mln | >25m |
|
||||
| >100mln | >10m |
|
||||
| <100mln | >5m |
|
||||
|
||||
--- With assistance by Francesca Maglione
|
||||
@ -0,0 +1,226 @@
|
||||
TL:DR -- I believe inflation is the match that has been lit that will light the fuse of our rocket. Part 2
|
||||
=========================================================================================================
|
||||
|
||||
| Author | Source |
|
||||
| :-------------: |:-------------:|
|
||||
| [u/Dismal-Jellyfish](https://www.reddit.com/user/Dismal-Jellyfish/) | [Reddit](https://www.reddit.com/r/Superstonk/comments/oe6i3l/tldr_i_believe_inflation_is_the_match_that_has/) |
|
||||
|
||||
---
|
||||
|
||||
[DD 👨🔬](https://www.reddit.com/r/Superstonk/search?q=flair_name%3A%22DD%20%F0%9F%91%A8%E2%80%8D%F0%9F%94%AC%22&restrict_sr=1)
|
||||
|
||||
[](https://preview.redd.it/ehs02c6dwd971.gif?format=mp4&s=1d76c4fc8a45cd543d9a2ffeb4cd2eff02f74138)
|
||||
|
||||
Good morning r/Superstonk, neighborhood jellyfish here!
|
||||
|
||||
I would like to revisit some more data recently released and posted and continue trying to tie this all together as the situation continues to evolve.
|
||||
|
||||
Posts being referenced: [1st Inflation Post](https://www.reddit.com/r/Superstonk/comments/nxxwqt/tldr_i_believe_inflation_is_the_match_that_has/), [Existing Home Sales May](https://www.reddit.com/r/Superstonk/comments/o6ie6p/a_deep_dive_into_the_housing_data_released/), [New Home sales May](https://www.reddit.com/r/Superstonk/comments/o6soxw/part_ii_a_deep_dive_into_the_housing_data/), [Fed Balance Sheet through 6/16](https://www.reddit.com/r/Superstonk/comments/o2dw45/thoughts_on_the_feds_balance_sheet_after_todays/), [It's not just manufacturing supply shortages, manufacturers can't get people for work](https://www.reddit.com/r/Superstonk/comments/od9tt1/a_deep_dive_into_some_more_of_the_data_released/), [6.4% annualized inflation (PCE, excluding food and energy the most conservative inflation measure US government releases and the Fed relies on)](https://www.reddit.com/r/Superstonk/comments/o7r4zw/the_feds_favorite_inflation_measure_which_is_the/)
|
||||
|
||||
I want to start by revisiting the Fed's balance sheet. The last time we talked about it (6/17), it stood at a then RECORD $8.064 trillion. Let's write this one out: $8,064,000,000,000.As of July 1st, that number stands at a NEW RECORD $8,078,544,000,000---an increase of $14,544,000,000.
|
||||
|
||||
[](https://preview.redd.it/z8dnwn5swd971.png?width=1827&format=png&auto=webp&s=6c72023ffe5b27cd93dfceb0df11fbf263ec6d5b)
|
||||
|
||||
$8,078,544,000,000
|
||||
|
||||
[](https://preview.redd.it/jwxf3k0uwd971.png?width=1465&format=png&auto=webp&s=ceb3523e78313f82c4376e1fb65ec775e1b9cc16)
|
||||
|
||||
Look at that triangle that has started at $7 trillion!
|
||||
|
||||
So what caused the jump in the balance sheet?
|
||||
|
||||
The Treasury General Account (TGA), which Yellen said in February she wanted to [get to $500 billion by the end of June](https://home.treasury.gov/news/press-releases/jy0011), actually increased by $86.815 Billion to $851 Billion.
|
||||
|
||||
Federal Reserve Notes, net jumped $4,594 million.
|
||||
|
||||
The Fed's balance sheet is jumping while we are watching the housing bubble inflate in front of us.
|
||||
|
||||
The rate of sales continues to trend downward, but median home prices for existing homes are up 23.6% year-over-year to an all-time high of $350,300 with May rising at the greatest year-over-year pace since at least 1999, up from $283,500 last year and $340,600 in April.
|
||||
|
||||
So, months' supply is increasing (supply taking longer to move), sales are beginning to decrease (.9%) (demand), and median existing-home price across all housing types hit a record high of $350,300 in May, an increase of 23.6% from the year before (price).
|
||||
|
||||
Despite supply increasing for months, single-family home sales by homebuilders to the public in May fell 6% from the prior month to a seasonally adjusted annual rate of 769,000 houses, down 23% from the recent high in January. This steep decline in sales occurred amid rising prices.
|
||||
|
||||
The median price of new single-family houses rose 2.5% from the previous month, and spiked 18.1% year-over-year, to a record $374,400:
|
||||
|
||||
[](https://preview.redd.it/4xj0opyl1e971.png?width=802&format=png&auto=webp&s=6690f087ada69f13a8c35b8841a34c4d48e036c1)
|
||||
|
||||
The drop in sales of new homes in the past months brought sales back to about pre-pandemic levels. On the other end of our equation, inventory really is rising!
|
||||
|
||||
Unsold speculative houses rose for the fifth month in a row to 330,000 houses and months' supply rose to 5.1 months.
|
||||
|
||||
New single-family homes completed since Jan 2021 : 1,328,000+1,347,000+1,497,000+1,426,000+1,368,000 = 6,966,000 homes
|
||||
|
||||
New single-family homes sold since Jan 2021 : 993,000 +823,000+886,000+817,000+ 769,000 = 4,288,000 homes
|
||||
|
||||
Supply is up +2,678,000 homes in 2021 so far.
|
||||
|
||||
Stated another way:
|
||||
|
||||
The current supply is steadying with current inventory not moving at the current prices and is increasing as more homes come online (census bureau has it at ~ 4-8 months in 2020 to build from start to finish, projects started during the pandemic will be coming online), Demand is decreasing, Median Prices has increased to an all-time high.
|
||||
|
||||
With the conditions of the housing market above, I believe we are entering 'textbook' bubble territory.
|
||||
|
||||
[](https://preview.redd.it/bcoa3frsxd971.png?width=794&format=png&auto=webp&s=3d348043be4dd619112aad871705fd00ba02f737)
|
||||
|
||||
Source: https://www.investopedia.com/terms/h/housing_bubble.asp
|
||||
|
||||
Ok, as we covered above, demand had been through the roof, but the supply is back on the rise and current stock is taking longer to move. At the same time, demand for new mortgages is decreasing as the supply continues to hold and increase---but prices continue to go up!
|
||||
|
||||
[](https://preview.redd.it/e8ge1yn0yd971.png?width=884&format=png&auto=webp&s=adbea8646a332e991679cf2214603ff39a2b499e)
|
||||
|
||||
But what about delinquency rates? This can be a source to the supply...
|
||||
|
||||
[](https://preview.redd.it/e2jq2nc3yd971.png?width=1111&format=png&auto=webp&s=20b980c2faf5d470a30dc34a8f3106acdfc79fc3)
|
||||
|
||||
https://www.mba.org/2021-press-releases/may/mortgage-delinquencies-decrease-in-the-first-quarter-of-2021
|
||||
|
||||
> On a year-over-year basis, total mortgage delinquencies increased for all loans outstanding. The delinquency rate increased by 141 basis points for conventional loans, increased 498 basis points for FHA loans, and increased 297 basis points for VA loans.The delinquency rate includes loans that are at least one payment past due but does not include loans in the process of foreclosure. The percentage of loans on which foreclosure actions were started in the first quarter rose by 1 basis point to 0.04 percent. The percentage of loans in the foreclosure process at the end of the first quarter was 0.54 percent, down 2 basis points from the fourth quarter of 2020 and 19 basis points from one year ago. This is the lowest foreclosure inventory rate since the first quarter of 1982.The seriously delinquent rate, the percentage of loans that are 90 days or more past due or in the process of foreclosure, was 4.70 percent. It decreased by 33 basis points from last quarter and increased by 303 basis points from last year. From the previous quarter, the seriously delinquent rate decreased 34 basis points for conventional loans, decreased 19 basis points for FHA loans, and decreased 37 basis points for VA loans. Compared to a year ago, the seriously delinquent rate increased by 205 basis points for conventional loans, increased 771 basis points for FHA loans, and increased 379 basis points for VA loans.
|
||||
|
||||
Then there are those still in or coming out of forbearance with the likely expiration and non-renewal of these Covid rules at the end of the month:
|
||||
|
||||
[The Mortgage Bankers Association's (MBA) latest Forbearance and Call Volume Survey revealed that the total number of loans now in forbearance decreased by 2 basis points from 4.18% of servicers' portfolio volume in the prior week to 4.16% as of May 30, 2021. According to MBA's estimate, 2.1 million homeowners are in forbearance plans.](https://www.mba.org/2021-press-releases/june/share-of-mortgage-loans-in-forbearance-slightly-decreases-to-416-percent)
|
||||
|
||||
[](https://preview.redd.it/1hp4jrdbyd971.png?width=1169&format=png&auto=webp&s=33d5b84e2ff464c95a84049f5887674a1bc3f224)
|
||||
|
||||
While it is great to see people come out of forbearance, if I am reading the numbers correctly, more than half of folks coming out are still going to have amounts that still need to be paid back. Budgets are already stretched tight, wage growth is decreasing, and inflation is making everything else more expensive.
|
||||
|
||||
So, the central-bank asset purchases that continue chugging along [($120 billion per month](https://www.wsj.com/articles/central-bank-will-begin-reducing-bond-purchases-well-before-raising-interest-rates-powell-says-11618421656)) continue to help directly inflate this bubble! The music on inflating home prices is going to stop!
|
||||
|
||||
This brings me back to a comment from earlier this week I made in the RRP's post:
|
||||
|
||||
> Inflation is blowing up as they have a full-blown liquidity crisis on their hands!
|
||||
>
|
||||
> The Fed has backed themselves & the banks in a corner after letting the printer run brrrrr. High Reverse Repo Purchase usage signals that the banks simply don't have the balance sheets to accept the excess reserves. Even accounting for end-of-quarter use spiking, $991.939 billion to 90 participants is absolutely bonkers!!!
|
||||
>
|
||||
> Thus, they are forced to park them right back with the Fed using the [Overnight Reverse Repo Purchase and 0.05% lending](https://apps.newyorkfed.org/markets/autorates/temp).
|
||||
>
|
||||
> This has created a dangerous game of chicken in the market. Currently, the liquidity in the market is entirely artificial because of the aforementioned brrrrr. If the Fed lets up the slightest bit on the central-bank asset purchases [($120 billion per month currently](https://www.wsj.com/articles/central-bank-will-begin-reducing-bond-purchases-well-before-raising-interest-rates-powell-says-11618421656)), it could shut down the entire game. However, if JPow keeps letting the printer run, he risks hyperinflation and [further cracks in support from his members](https://web.archive.org/web/20210630081637/https:/www.nytimes.com/2021/06/30/business/economy/inflation-federal-reserve.html).
|
||||
>
|
||||
> It's turned into either no more liquidity for anyone or so much liquidity that the value of USD becomes near worthless and we see [Weimar Republic levels of hyperinflation.](https://en.wikipedia.org/wiki/Hyperinflation_in_the_Weimar_Republic)
|
||||
>
|
||||
> For GME, I believe the thought is that no liquidity means institutions will have to sell off other assets to increase their capital supply. This will continue until they can no longer increase their capital supply to meet margin requirements.
|
||||
>
|
||||
> When/if institutions cannot meet their margin requirements (aka prove liquidity to be able to cover positions), DTCC will forcibly close all of their positions and MOASS takes flight
|
||||
|
||||
This is the game of chicken the Fed is caught up in---demand for housing (as we covered above) is going down, supply is increasing, yet prices continue to inflate---I believe this is in large part because of the $120 billion per month central bank MBS is allowing prices to continue to increase and build this bubble!
|
||||
|
||||
Let's revisit the rate of inflation from my first post. The [CPI report](https://www.reddit.com/r/Superstonk/comments/nwodvj/the_consumer_price_index_climbed_06_from_the/) had inflation at 5% and we reviewed ICE BofA Single-B US High Yield Index Effective Yield @ 4.47% -.53% adjusted for inflation (Highly Speculative) and ICE BofA CCC & Lower US High Yield Index Effective Yield @ 6.83% 1.83% adjusted for inflation ("extremely speculative" to "default is imminent with little prospect for recovery").
|
||||
|
||||
Annualizing the Personal Consumption Expenditures, excluding food and energy (PCE), again the *most conservative* inflation number the government offers, from the BEA report the other day, inflation is at 6.4%--inflation is at least 28% higher than the first time we examined this at 5%!!!
|
||||
|
||||
Looking at the bonds again, adjusted for inflation, things are worse!
|
||||
|
||||
[](https://preview.redd.it/2zrpzjetyd971.png?width=1468&format=png&auto=webp&s=9afed52a1cd40a63a9fb923cf8953c2559a15d48)
|
||||
|
||||
ICE BofA Single-B US High Yield Index Effective Yield @ 4.44% -1.93% adjusted for PCE inflation (Highly Speculative)
|
||||
|
||||
[](https://preview.redd.it/m0nc740uyd971.png?width=1463&format=png&auto=webp&s=4ef8591e2dc1146b2e6d241184a0178f6299e362)
|
||||
|
||||
ICE BofA CCC & Lower US High Yield Index Effective Yield @ 6.60% .2% adjusted for inflation ("extremely speculative" to "default is imminent with little prospect for recovery")
|
||||
|
||||
Can we let that sink in again for a moment? To get any sort of positive yield an investor must expose themselves to bonds rated "extremely speculative" to "default is imminent with little prospect for recovery". If they invest in the Single-B 'Highly Speculative' they lose principal capital to inflation!
|
||||
|
||||
Remember, they can't just sit on this cash as the dollar is losing buying power (as we have covered before), the cash would get eaten by inflation, and it is a liability for them---since they must pay interest on client cash. (This is where having *too much* cash is considered a liquidity crisis! There isn't enough good debt to place it in!). No wonder the Reverse Repo Markets are so heavily used!
|
||||
|
||||
Before we go any further, let's do some quick level setting on bonds and their risk descriptions:
|
||||
|
||||
[](https://preview.redd.it/5pbdgumczd971.png?width=839&format=png&auto=webp&s=032247d092bcbcc01e6b348857e2c16839955c33)
|
||||
|
||||
How the Credit Rating Agencies Classify Corporate Bonds and Loans by Credit Risk or the Risk of Default.
|
||||
|
||||
0:00
|
||||
|
||||
3:44
|
||||
|
||||
Any excuse to use this clip again makes my day...
|
||||
|
||||
Again, JPow believes this inflation is transitory and will drop back down to 2%. The Fed has been 2 steps behind on inflation and I think they are severely underplaying a new wild dynamic in this inflation madness---people and businesses are willing to pay these prices!
|
||||
|
||||
We have looked extensively at the record median prices in homes, but let's consider cars for a minute. This is why I think the inflation game has changed! According to data from the [Bureau of Economic Analysis](https://apps.bea.gov/iTable/iTable.cfm?1921=underlying&isuri=1&reqid=19&step=2#1921=underlying&isuri=1&reqid=19&step=2) June sales for autos fell to 1.30 million vehicles, down 14.2% from June 2019, after a strong March, April, and May.
|
||||
|
||||
Vehicle sales picture
|
||||
|
||||
The Seasonally Adjusted Annual Rate (SAAR) of sales,(takes the number of selling days and other seasonal factors into account and then annualizes the result), vehicle sales look:
|
||||
|
||||
June: 15.4 million SAAR, -9.5% from June 2019; the lowest for any month since January 2014.
|
||||
|
||||
May: 17.0 million SAAR, -1.0% from May 2019.
|
||||
|
||||
April: 18.6 million SAAR, the highest total for any month in 16 years, +7.4% from April 2019.
|
||||
|
||||
March: 17.9 million SAAR, +7.9% from March 2019.
|
||||
|
||||
Carmakers and dealers are making money hand over fist though! Dealers by and large don't produce 'economy' cars and trucks anymore. Everything is has shifted to high profit-margin vehicles---for example, Ford (except for the Mustang) doesn't produce cars anymore!
|
||||
|
||||
Because of this and shifting to have 'on-demand' inventories, the average transaction price for cars is at record highs, so is average gross profits per unit---the average transaction price (ATP) of new vehicles in June jumped 14.9% from a year ago, to $40,206, a [joint forecast from J.D. Power and LMC Automotive](https://www.businesswire.com/news/home/20210625005063/en/J.D.-Power-and-LMC-Automotive-U.S.-Automotive-Forecast-for-June-2021)---a record surge,
|
||||
|
||||
> The combination of strong retail volumes and higher prices means that consumers are on track to spend $45.6 billion on new vehicles this month, the highest on record for the month of June. Consumer expenditures on new vehicles are expected to reach a Q2 record of $149.7 billion, up 60.7% from 2020 and up 27.9% from 2019.
|
||||
>
|
||||
> Total retailer profit per unit, inclusive of grosses and finance & insurance income, is on pace to reach an all-time high of $3,908, an increase of $2,061 from a year ago. Grosses have been above $2,000 for 11 of the past 12 months. Coupled with the strong retail sales pace, total aggregate retailer profits from new-vehicle sales will be $4.4 billion, the highest ever for the month of June and up an astounding 175% from June 2019.
|
||||
>
|
||||
> The combination of strong retail volumes and higher prices means that consumer expenditures on new vehicles are expected to reach a first-half record of $270.8 billion, up 47.8% from 2020 and up 24.7% from 2019.
|
||||
>
|
||||
> Retailer profits from new-vehicle sales will reach first-half record levels on both, a per unit, and total basis. Profit per unit for the first half of 2021 will reach $2,844, up $1,310 from the same period in 2020 and up $1,457 from 2019, while total profits will reach $20.2 billion, up $12.1 billion from 2020 and up $11.2 billion from 2019.
|
||||
|
||||
The trade-in market is also nuts! [The chip shortage](https://www.detroitnews.com/story/business/autos/ford/2021/07/02/ford-sales-fall-27-june-lingering-chip-shortage/7839245002/) and covid have set the secondary market on fire. Normally, it is tempered through rental car companies and the like offloading their fleets. Covid has thrown a huge wrench into that, and add in the chip shortage in new vehicles, has led to what I believe is the fairy dust on this inflation fire, reports of low-mileage used vehicles costing more than the new model would cost if it were available.
|
||||
|
||||
(timeout, I do hope RC and the GameStop team are reading up on how Toyota is killing this chip shortage since they had this sort of risk already identified in their Business Continuity Plan because of what happened with Fukushima in 2011!)
|
||||
|
||||
A study by [iSeeCars](https://www.iseecars.com/used-cars-cost-more-than-new-study), which combed through over 470,000 new vehicles and "lightly used" 2019 and 2020 model-year vehicles, found that the gap between new and slightly used had "drastically narrowed" across the board, and it found that 16 hot models were selling for more money as used vehicles than their equivalent new versions, that were not in stock.
|
||||
|
||||
On top of this list is the Kia Telluride, it would sell for $44,166 as new vehicle sold for $47,730 as a slightly used vehicle. The first six on the list were either pickups (GMC Sierra 1500, Toyota Tacoma, Toyota Tundra) or SUVs (Telluride, Mercedes-Benz G-Class, Toyota RAV4 Hybrid).
|
||||
|
||||
Rather than haggle till they get the price down, or just not buy as they had done for a couple of years of the Great Recession, consumers are buying are paying whatever it takes to get a new or used vehicle or new or used home as their whole mindset about inflation has changed!
|
||||
|
||||
[](https://preview.redd.it/75z9o0bf0e971.png?width=600&format=png&auto=webp&s=be0146e852127aa6467848a5b4a3d31189834415)
|
||||
|
||||
The brakes on inflation have been cut! This beast is going to keep running!
|
||||
|
||||
OK, so to try and wrap this up again:
|
||||
|
||||
- More cash is going to continue to pour in that needs to be placed.
|
||||
|
||||
- Inflation is going to make it impossible to earn positive rates on assets after being adjusted for inflation on anything but "extremely speculative" to "default is imminent with little prospect for recovery" risks.
|
||||
|
||||
- Cash can be stashed with the Fed @ 0.05% currently
|
||||
|
||||
- Previous collateral (zombie CMBS as an example) is considered junk and may be losing value due to being mistakenly rated/valued to begin, with yield rates, which had been used to secure the balance sheet now also being eaten by inflation. ([Washington Prime Group and certain of its subsidiaries filed for Chapter 11 bankruptcy protection since the last time](https://investor.washingtonprime.com/investor-relations/news-and-views/news/news-details/2021/Washington-Prime-Group-Commences-Voluntary-Chapter-11-Financial-Restructuring-with-RSA-Supported-by-Over-70-of-Holders-of-Secured-and-Unsecured-Corporate-Debt/default.aspx))
|
||||
|
||||
- Their cash can't be used as collateral because it is a liability, and even if used, will suffer a loss of value from inflation.
|
||||
|
||||
Opinion: Because of inflation, the shorts are going to drown in their cash. There is no place for it to go to earn a positive yield greater than what inflation will eat, or should be acceptable for the level of risk of default.
|
||||
|
||||
With nowhere to park this cash to generate positive yields and while having to contend with balance sheets that are having assets eaten away, participants will continue to use the Reverse Repo to buy time until:
|
||||
|
||||
Being down in real terms because of inflation is something that cannot be made back up to service the debt and will weigh on balance sheets as they try to protect from margin calls.
|
||||
|
||||
Their existing collateral on the balance sheet can get re-rated lower, re-appraised lower, or just eaten by inflation to the point even what they are borrowing in treasuries can't meet the requirements to hold off a margin call.
|
||||
|
||||
They hit the 80 billion Reverse Repo limit because of nowhere else to place cash, are tapped out on treasuries, and no longer able to post acceptable collateral to meet their margin requirements.
|
||||
|
||||
Finally, GameStop now faces inflation concerns because of that fat stack of cash they have ready to deploy!
|
||||
|
||||
I am sure RC and company have plans to deploy that capital in ways that will earn more than the rate of inflation, but I would like to propose they consider setting at least 1% of that cash aside to hedge the company against inflation moving forward to invest in b I t c o I n and e t h e r e u m.
|
||||
|
||||
I know this investment suggestion is probably controversial! However, I've been in crypto longer than GameStop (and DFV has been in GameStop), and it was understanding these fundamentals that helped make his explanations and some of the DD here click for me to ape into GameStop when I learned about it.
|
||||
|
||||
I am happy to touch on these subjects in the comments further (but I do want to keep this on the topic as much as possible and try and wrap up), but in short, I believe in [PlanB's Stock-to-Flow](https://twitter.com/100trillionUSD) hypothesis on b I t c o I n.
|
||||
|
||||
I think GameStop could benefit some cash to this asset that cannot be inflated away, and as Elon proved, can be turned from cash-b I t c o I n-cash instantly.
|
||||
|
||||
More importantly, though, I think the company should allocate a portion of that to staking e t h e r e u m and offering the ability to stake to GameStop's user base.
|
||||
|
||||
In the future, I believe GME values decentralization of ownership of our digital assets, which is why we should buy and mint NFT's on GameStop's Blockchain.
|
||||
|
||||
For the less blockchain familiar GameStop users, I think GameStop should open up the protocol to allow ETH2 staking with GME? Empower the players to secure the metaverse?
|
||||
|
||||
For the balance sheet though, if you're staking on E t h e r e u m 2.0, E t h e r e u m 's parallel PoS network, your operations are earning you a roughly 8% annual percentage return (APR). This number is higher than the rate of inflation that we covered as well! Yes, E t h e r e u m fluctuates in price, but as we covered above, staking will also further secure and make the network stronger, which in turn does the same for the metaverse!
|
||||
|
||||
EIP-1559 is in flight. What this means is that net "issuance" of new coins minted is going to be dramatically lowered. To put it in perspective, the issuance rate right now is 4.5% per year, the estimates for the issuance rate after EIP 1559 is implemented are .5 - 1%. Why does this matter?
|
||||
|
||||
So b I t c o in issuance halves every 4 years right? (this is what makes the stock-to-flow model tick) Well, an issuance drop from 4.5% is the equivalent of 3 halvenings happening at one time. (4.5 cut in half to 2.25 again to 1.125 and again to .56). E t h e r e u m is already at a multi-year low supply on exchanges, once this happens E t h e r e u m will become more instantly scarce. People have dubbed this the "Cliffening".
|
||||
|
||||
I believe this increasingly scarce asset that will also secure the metaverse would be a great place to place cash to avoid inflation!
|
||||
|
||||
TL:DR -- I believe inflation is the match that has been lit that will light the fuse of our rocket.
|
||||
@ -0,0 +1,34 @@
|
||||
# GameStop Continues Expansion of Fulfillment Network with New Facility in Reno, Nevada
|
||||
|
||||
| Author | Source |
|
||||
| :-------------: |:-------------:|
|
||||
| [GameStop](https://gamestop.gcs-web.com/about-gamestop) | [GameStop Newsroom](https://gamestop.gcs-web.com/news-releases/news-release-details/gamestop-continues-expansion-fulfillment-network-new-facility) |
|
||||
|
||||
---
|
||||
|
||||
|
||||
### Company's Fulfillment Network Will Span Both Coasts of Continental U.S.
|
||||
|
||||
GRAPEVINE, Texas, July 06, 2021 (GLOBE NEWSWIRE) -- GameStop Corp. (NYSE: GME) ("GameStop" or the "Company") today announced the continued expansion of its North American fulfillment network and entry into a lease of a 530,000 square foot facility in Reno, Nevada, which is expected to be operational in 2022. The Company's new presence in Reno, Nevada will position it to grow product offerings and expedite shipping across the west coast. This expansion follows GameStop's entry into a lease of a 700,000 square foot facility in York, Pennsylvania.
|
||||
|
||||
**About GameStop.**
|
||||
|
||||
GameStop, a Fortune 500 company headquartered in Grapevine, Texas, is a leading specialty retailer offering games and entertainment products through its E-Commerce properties and thousands of stores. Visit [www.GameStop.com](https://www.globenewswire.com/Tracker?data=ubHFIoLmjsWy9dNOO6qrBq5M3Y0ci5Ry2IN4BFMcT6NWMXPGoln88QkepZ5m9Tr49GEAjMDOo5ACFJO8UZgNAw==) to explore our products and offerings. Follow @GameStop and @GameStopCorp on Twitter and find us on Facebook at [www.facebook.com/GameStop](https://www.globenewswire.com/Tracker?data=siFKGssSrTQ8yxwDmGXAk0hqPR_ykV5sXf270PkLa3JCjFLQFSb-wbdyrQ_pW1HaJAoU_nLrLWIuAzVHPYXZHbrPL6gSTMQjZ5Nk7ZnoDjM=).
|
||||
|
||||
**Contact**
|
||||
|
||||
For Stockholders:
|
||||
|
||||
GameStop Investor Relations
|
||||
|
||||
817-424-2001
|
||||
|
||||
[investorrelations@gamestop.com](https://www.globenewswire.com/Tracker?data=ZUbZyG8w2f_Ys2cQS0q0FboY2Z6vDxBqEbth4XM_XthxbRU8_ege3yjGGmNxojmhOiC4hxyXBFD1QbaY8fd-kZ_0LgPeNHxdnFXlP2pBcHpSJjZKMORF3KLSIdiN-Z2a)
|
||||
|
||||
For Media:
|
||||
|
||||
MKA
|
||||
|
||||
Greg Marose / Charlotte Kiaie
|
||||
|
||||
[gamestop@mkacomms.com](https://www.globenewswire.com/Tracker?data=X5Jl5EaiulTWZRjHqRipYsyVDxWsnx5YWLO5glEwS5rBSqmfmw_B3UP1oFYFQD-a3fTTO8kLXjLOwxRPWFpkVX8VAyovre0zsHeM6ED1mL8=)
|
||||
@ -0,0 +1,127 @@
|
||||
Q2 US House Stock Trading Activity Highlights (51 members had >$32M activity) 👀👀👀
|
||||
====================================================================================
|
||||
|
||||
| Author | Source |
|
||||
| :-------------: |:-------------:|
|
||||
| [u/w2re3tr4](https://www.reddit.com/user/w2re3tr4/) | [Reddit](https://www.reddit.com/r/Superstonk/comments/of7bqd/q2_us_house_stock_trading_activity_highlights_51/) |
|
||||
|
||||
---
|
||||
|
||||
[DD 👨🔬](https://www.reddit.com/r/Superstonk/search?q=flair_name%3A%22DD%20%F0%9F%91%A8%E2%80%8D%F0%9F%94%AC%22&restrict_sr=1)
|
||||
|
||||
TLDR: MSFT & GOOG were the top 'buys'... both by the same one (1) Rep who isn't afraid to hold Big Tech stocks.
|
||||
|
||||
Another (1) Rep sold >$1M to $5M of BRP right before a -21% dip over 16 days (nice timing Mr. Congressman).
|
||||
|
||||
The 'granddaughter of a billionaire' Rep sold a lot of stocks (all in one day) and sold a lot of bonds (all in one separate day) from her 5+ trust accounts... no buys.
|
||||
|
||||
And just two (2) other Reps generated ~56% of ALL stock trading activity for the entire House in Q2. Will another ape answer the call to dive deeper to see what they're really up to?
|
||||
|
||||
****************************
|
||||
|
||||
DATA BELOW IS SHARES ONLY (no options) WITH ESTIMATED Totals for Q2 2021 based primarily on date of public disclosure (it's a pain in the ass to piece these together manually... they sure don't make it easy to follow along to what they're doing. Date disclosed is different than date of trade, and I've seen trades not disclosed for 5+ months. Anyone on the House Ethics committee read this sub?):
|
||||
|
||||
548 purchases for >$17.8M to $49.5M *(the Periodic Transaction Report "PTR" forms use amount ranges instead of exact values)*
|
||||
|
||||
477 sales for >$14.3M to $33.9M *(ranges do provide the gross floor and gross ceiling****)***
|
||||
|
||||
It looks like the US House was a Net buyer of stocks in Q2 2021. Individuals who stood out during Q2 are described below.
|
||||
|
||||
****All data below assumes MINIMUM value of the reporting range unless otherwise stated, and therefore could be completely inaccurate or misleading. There is no guarantee the data I used from official government sources is accurate or complete. According to* [*history.house.gov*](https://history.house.gov/)*,* *it looks like only one Rep was expelled since 1980 & only one Rep was censured since 1983 (for any reason). I can't find any links that show any kind of punishment for filing a PTR untimely or not at all... so I'm sure it's all on the up & up. Finally, I'm not a financial advisor and this isn't financial advice. Now onto the pictures!*
|
||||
|
||||
[](https://preview.redd.it/hrgjq0f6ej971.jpg?width=500&format=pjpg&auto=webp&s=ed1556df5ab616c603006f9b425377d0742917b7)
|
||||
|
||||
Seal since 1789, last updated in 1987. Peace on the left foot, war on the right foot, and 13's all around.
|
||||
|
||||
Highest single $ trades ($1M to $5M bracket):
|
||||
|
||||
[](https://preview.redd.it/d5emaf9jrj971.jpg?width=634&format=pjpg&auto=webp&s=867edff69229229728b177308a6c583364fbc806)
|
||||
|
||||
Nancy Pelosi (Speaker of the House) & Paul Pelosi (Venture Capitalist), April 23, 2019 'Bought the Dip in Feb 2020'
|
||||
|
||||
1) Nancy Pelosi (1987 Rep + Speaker of the House from California... via Paul Pelosi, her 81-year-old Venture Capitalist CEO husband), on last Friday 7/2/21 disclosed they exercised $4.8M of GOOG calls on 6/18/21 that she/they bought on 2/27/20. Interesting they didn't just take the LTCG status on those call options (that went brrrrr) since the share price more than doubled between buy & exercise.
|
||||
|
||||
A trade of this size only happened three times during ALL of Q2 (two of which were by Nancy/Paul). Prior to this DD, I knew Paul Pelosi was a big investor and fully expected him on this list - he may be the most interesting investor to watch in Congress (other than two super traders below). Nancy Pelosi (+ Paul) is estimated to be the 7th wealthiest member of Congress with >$114M Net Worth. I had not heard of anyone else on this list before this DD.
|
||||
|
||||
On 4/9/21, Nancy/Paul disclosed they exercised $3.35M of MSFT calls on 3/19/21 that they bought on 2/20/20 & 2/28/20. Granted, you could have bought almost anything during late February 2020 and made $$$, but these are long term call options that were exercised instead of sold. Perhaps the biggest story is they don't seem to have any issue with holding more Big Tech stocks, even when they could have taken LTCG instead.
|
||||
|
||||
Also on 4/9/21, Nancy/Paul disclosed purchasing ~$690k worth of RBLX, which has since jumped +24% with a peak of +49% on 6/4/21. Told you Paul knows his shit.
|
||||
|
||||
[](https://preview.redd.it/s60e5iw6sj971.jpg?width=220&format=pjpg&auto=webp&s=235bdcf84067ca3d9c1016d7e09a085d7ae2d909)
|
||||
|
||||
Scott Franklin, January 2021 'Sold BRP >$1M right before a -21% dip'
|
||||
|
||||
2) Scott Franklin (freshman Rep from Florida, 26 year Navy vet turned Insurance CEO) on 6/1/21 disclosed he sold $1M-$5M of BRP on 4/27/21. BRP then immediately dropped -21.6% over the next two weeks after he sold, and is currently -9% from the 4/27/21 close price. This single trade made Scott Franklin the 8th highest $ value trader for Q2 (and it was a pretty well timed trade). Scott Franklin is a Managing Partner in BRP group who acquired his former company Lanier Upshaw in January 2021, so not totally out of the blue... but good for a top 2 spot with the Pelosi's for biggest single trade in Q2.
|
||||
|
||||
****************************
|
||||
|
||||
Other High $ single trades to watch in the House:
|
||||
|
||||
[](https://preview.redd.it/dbumg6cfsj971.jpg?width=220&format=pjpg&auto=webp&s=3ac0de573b36dd3136917ae26f55ab3f8975e7a8)
|
||||
|
||||
Patrick Fallon, January 2021 'Sure would be a shame if some Ape went super DD on me'
|
||||
|
||||
Patrick Fallon (freshman Rep from Texas - former Air Force medal recipient turned military clothing company CEO)... this guy swing trades like crazy with same day/ticker buy & sell disclosures, often using duplicate disclosures for the same position on the same day... reported almost 5 months after the trade happened (PYPL 1/19/21 activity disclosed on 6/17/21). **Definitely worth having someone take a deeper look.** On a gross basis, Patrick Fallon Purchased >$5.8M and Sold >$3.9M for a total gross activity of >$9.7M *(this could be as high as $21.7M if Max value in range is used instead of Min value)*. Patrick Fallon was the #1 highest $ trader in Q2 (putting aside the above Pelosi-MSFT speculation). He traded 140 times during Q2, which only has 63 trading days (>2.2x trades per day). *Seriously, can someone please deep dive into this guy, there's a large cloud of smoke coming from the Dallas area....*
|
||||
|
||||
[](https://preview.redd.it/142jlpnqsj971.jpg?width=220&format=pjpg&auto=webp&s=a2f19393f1708560780f71597aaa792229c9bffa)
|
||||
|
||||
Mark Green, January 2019 'Sure would be a shame if I also got audited'
|
||||
|
||||
Mark Green (2019 Rep from Tennessee - former Army Major turned physician/surgeon turned hospital staffing company CEO)... **2nd most active trader, another one probably worth taking a deeper look into.** Mark Green looks like net buyer in April & May turned net seller in June... but disclosure only requires ranges and dates are delayed, so with that many transactions I cannot be 100% sure. Mark Green was the #2 highest $ trader in Q2 with >$9.1M in total gross activity. He traded 56 times during Q2 (>0.8x trades per day).\
|
||||
*Side note: This guy was also apparently 'too toxic' for the 45th President, who had to withdraw Mark Green from nomination for Army Secretary in 2017 (*[*https://duckduckgo.com/?t=ffab&q=mark+green+withdrawn+from+consideration+due+to+comments*](https://duckduckgo.com/?t=ffab&q=mark+green+withdrawn+from+consideration+due+to+comments)*). Don't care what side you're on, any time a nominee has to get withdrawn (by the Party who has a full majority) for any reason is a huge red flag... can someone please deep dive into this guy?*
|
||||
|
||||
[](https://preview.redd.it/vgf84f4usj971.jpg?width=220&format=pjpg&auto=webp&s=8e8238f8cc94f5fa581df71bf80a0dd41d2a1231)
|
||||
|
||||
Victoria Spartz, January 2021 'Buying SPG, Selling airlines'
|
||||
|
||||
Victoria Spartz (freshman Rep from Indiana, Ukrainian born US citizen in 2006, local Indiana Tea Party founding member, former CFO of Indiana Attorney General, 'real estate and farming businesses') bought $500k-$1M of SPG on 6/10/21. She bought the top, and SPG is currently -3.6% from 6/10/21's closing price. She also bought SPG on 5/12/21 for $100k-$250k. She had three (3) other trades that brought her to the 6th highest $ value trader (buy gross + sell gross) for Q2, including selling ALK on 5/17/21 (-17% since she sold) & LUV on 5/18/21 (-15% since she sold)... both disclosures showed up as "amended"... hmmm.....
|
||||
|
||||
[](https://preview.redd.it/4jqqm0x3tj971.jpg?width=220&format=pjpg&auto=webp&s=8963128b60720e18ce4534bd92b0f6a1a5cd8f3b)
|
||||
|
||||
Suzan DelBene, January 2017 'Has more money than you, but still paper handed MSFT in March 2021'
|
||||
|
||||
Suzan DelBene (2012 Rep from Washington - worked at MSFT 1989-1998 & 2004-2007, other high level tech executive work between and after). Disclosed on 4/13/21 that she Sold $500k-$1M of MSFT on 3/4/21 for ~$226/share, MSFT currently at $277.65/share, so she sold -22% from current (ouch). This one trade put Susan Delbene as the 10th highest $ trader for Q2, with nearly all of her other trading activity coming from Municipal Bond sales & purchases. Suzan DelBene is estimated to have the 9th highest Net Worth in Congress with ~$80M.
|
||||
|
||||
****************************
|
||||
|
||||
Largest Net Sellers:
|
||||
|
||||
[](https://preview.redd.it/s1bidembtj971.jpg?width=220&format=pjpg&auto=webp&s=b3ec9a081010fdc6514d559a8aab97904796216c)
|
||||
|
||||
Sara Jacobs, January 2021 'My trusts are cashing out'
|
||||
|
||||
1) Sara Jacobs (freshman Rep from California, youngest California Rep at age 32, granddaughter of Qualcomm founder billionaire Irwin Jacobs), disclosed on 5/28/21 sold 40 different stocks, all on 4/9/21, for $1.1M to $1.4M (via three separate Trusts, all smaller sales, no single one for >$50k)... no other sales or purchases in Q2.
|
||||
|
||||
On 7/2/21, Sara disclosed she sold 10 different California Municipal Bonds for $1M-$2.5M on 5/3/21.
|
||||
|
||||
I wonder what's going on in Sara's world where her Trusts seem to be selling everything....
|
||||
|
||||
2) Scott Franklin, sold $1M-$5M NET, single sale. See above.
|
||||
|
||||
3) Suzan Delbene, sold >$500k NET, single sale. See above.
|
||||
|
||||
****************************
|
||||
|
||||
Largest Net Buyers:
|
||||
|
||||
1) Nancy Pelosi, >$3M. See above.
|
||||
|
||||
2) Patrick Fallon, >$1.9M (estimated based on the Minimums Only of each range! Because he has so much activity in both direction and sizes, Patrick Fallon could have actually been a NET SELLER). See above.
|
||||
|
||||
[](https://preview.redd.it/8fgitbbstj971.jpg?width=220&format=pjpg&auto=webp&s=455a2abb7ffeb15dd97f6e552095a0a4ba198b77)
|
||||
|
||||
Kevin Hern, January 2019 'He's McLoving this bull market'
|
||||
|
||||
3) Kevin Hern (2018 Rep from Oklahoma -- former Ph.D. astronautical engineering now owns 18 McDonald's in Tusla area), bought $1.8M-$4.0M across 41 transactions almost exclusively on 6/15/21 (with an additional $75k bought on 4/9), with no sales in Q2. Kevin Hern's most notable purchase was ADBE $250k-$500k which is +21% since he bought on 5/20/21. Kevin Hern was the 4th highest $ trader in Q2 with >$1.8M.
|
||||
|
||||
*SOURCES:*
|
||||
|
||||
*Data above is from Periodic Transaction Reports (PTRs** as required by the "Ethics in Government Act of 1978" (passed in the wake of the Nixon Watergate scandal:)* [*https://en.wikipedia.org/wiki/Ethics_in_Government_Act*](https://en.wikipedia.org/wiki/Ethics_in_Government_Act)*)*
|
||||
|
||||
[*https://disclosures-clerk.house.gov/PublicDisclosure/FinancialDisclosure*](https://disclosures-clerk.house.gov/PublicDisclosure/FinancialDisclosure)
|
||||
|
||||
[*https://www.quiverquant.com/sources/housetrading*](https://www.quiverquant.com/sources/housetrading)
|
||||
|
||||
*(each Rep's wikipedia page**)*
|
||||
|
||||
[*https://www.opensecrets.org/personal-finances/top-net-worth*](https://www.opensecrets.org/personal-finances/top-net-worth)
|
||||
@ -0,0 +1,26 @@
|
||||
SEC Charges Three Individuals with Insider Trading
|
||||
==================================================
|
||||
|
||||
| Author | Source |
|
||||
| :----: | :----: |
|
||||
| [SEC](https://www.sec.gov/about.shtml) | [sec.gov](https://www.sec.gov/news/press-release/2021-121) |
|
||||
|
||||
---
|
||||
|
||||
|
||||
FOR IMMEDIATE RELEASE\
|
||||
2021-121
|
||||
|
||||
Washington D.C., July 9, 2021 ---
|
||||
|
||||
The Securities and Exchange Commission today charged three individuals with insider trading in advance of an announcement by Long Blockchain Company (formerly known as Long Island Iced Tea Co.) that it was going to "pivot" from its existing beverage business to blockchain technology, which caused the company's stock price to soar.
|
||||
|
||||
According to the SEC's complaint, filed in the U.S. District Court for the Southern District of New York, Eric Watson, an undisclosed control person of Long Blockchain who helped drive this business change within the company and signed a confidentiality agreement not to disclose the company's business plans, tipped his friend and broker, Oliver Barret-Lindsay, of such plans, including by sharing with him a draft of the company's press release. Barret-Lindsay, in turn, allegedly passed the material nonpublic information on to his friend, Gannon Giguiere. Within hours of receiving this confidential information, Giguiere purchased 35,000 shares of Long Blockchain stock. According to the complaint, the company's stock price skyrocketed after the press release was issued, spiking more than 380% intraday. Within two hours of the announcement, Giguiere sold his shares for over $160,000 in illicit profits.
|
||||
|
||||
"The SEC remains committed to preventing all types of fraudulent conduct in connection with purported 'crypto' companies, including profiting from trading on material non-public information," said Richard R. Best, Director of the SEC's New York Regional Office.
|
||||
|
||||
The SEC's complaint charges Watson, Barret-Lindsay, and Giguiere with violating Section 10(b) of the Securities Exchange Act of 1934 and Rule 10b-5 thereunder, and seeks permanent injunctions and civil penalties as to all defendants, and, additionally, an officer and director bar as to Watson.
|
||||
|
||||
The SEC [previously charged Barret-Lindsay and Giguiere](https://www.sec.gov/litigation/litreleases/2018/lr24201.htm) in connection with their alleged role in a stock manipulation scheme, which is currently in litigation. Both Lindsay and Giguiere pled guilty to criminal charges in connection with that matter. Additionally, the Commission [revoked the registration](https://www.sec.gov/litigation/admin/2021/34-91174.pdf) of Long Blockchain's securities on Feb. 19, 2021, pursuant to Section 12(j) of the Exchange Act.
|
||||
|
||||
The SEC's investigation has been conducted by Lindsay S. Moilanen, Mark R. Sylvester, Diego Brucculeri, John O. Enright, and Sheldon L. Pollock, and the litigation will be led by Ms. Moilanen and Mr. Sylvester. The case is being supervised by Sanjay Wadhwa.
|
||||
@ -0,0 +1,75 @@
|
||||
Remember that Climate Change Meeting in March? They discussed Hedge Funds.
|
||||
==========================================================================
|
||||
|
||||
| Author | Source |
|
||||
| :----: | :----: |
|
||||
| [u/I_DO_ANIMAL_THINGS](https://www.reddit.com/user/I_DO_ANIMAL_THINGS/) | [Reddit](https://www.reddit.com/r/Superstonk/comments/oh0mhl/remember_that_climate_change_meeting_in_march/) |
|
||||
|
||||
---
|
||||
|
||||
|
||||
[DD 👨🔬](https://www.reddit.com/r/Superstonk/search?q=flair_name%3A%22DD%20%F0%9F%91%A8%E2%80%8D%F0%9F%94%AC%22&restrict_sr=1)
|
||||
|
||||
Good afternoon Apes,
|
||||
|
||||
***I'm an idiot. None of this is advice. You do you.***
|
||||
|
||||
I was reading the [Monetary Policy Reports](https://www.federalreserve.gov/monetarypolicy/mpr_default.htm), as one usually do.
|
||||
|
||||
[](https://preview.redd.it/okiszbnbz7a71.jpg?width=859&format=pjpg&auto=webp&s=eed2fcffbce92142bf8332d96fea3b39f8adbee4)
|
||||
|
||||
and McDonalds provides the McFlurry. All is well.
|
||||
|
||||
The who-who started the what-what?
|
||||
|
||||
Page 31 of 7/9/21 report discusses Developments Related to Financial Stability.
|
||||
|
||||
[](https://preview.redd.it/wxkeu4fsz7a71.jpg?width=339&format=pjpg&auto=webp&s=394b7d8fa1ad8778e63051f2164ed4a096902468)
|
||||
|
||||
Angela is now in charge of the party planning committee.
|
||||
|
||||
[Financial Stability Oversight Council](https://home.treasury.gov/policy-issues/financial-markets-financial-institutions-and-fiscal-service/fsoc)
|
||||
|
||||
> *The Council is charged with identifying risks to the financial stability of the United States; promoting market discipline; and responding to emerging risks to the stability of the United States' financial system. The Council consists of 10 voting members and 5 nonvoting members and brings together the expertise of federal financial regulators, state regulators, and an independent insurance expert appointed by the President.*
|
||||
|
||||
[Hedge Fund Working Group](https://i.kym-cdn.com/entries/icons/original/000/019/277/confusedtravolta.jpg)
|
||||
|
||||
> *I can't find anything about this yet. ~IDAT*
|
||||
|
||||
Sausage Recipe: Closed Door Meeting Minutes from 3-31-2021
|
||||
|
||||
**A closed door session was called to order at 2:02 PM. Here's what was discussed until 3:07PM**
|
||||
|
||||
[](https://preview.redd.it/77ur2gpvz7a71.jpg?width=765&format=pjpg&auto=webp&s=9a91101ee03ddf250160b6927d111e2b4c357815)
|
||||
|
||||
Five hundred twenty five thousand six hundred minutes. How do you measure, measure incompetence?
|
||||
|
||||
HEDGE FUND ACTIVITIES
|
||||
|
||||
[](https://preview.redd.it/go6o4fkp08a71.jpg?width=770&format=pjpg&auto=webp&s=b525e7812cdccb98cb013fdfee27d62f5a779455)
|
||||
|
||||
....continued.
|
||||
|
||||
[](https://preview.redd.it/j4w8t5wm08a71.jpg?width=792&format=pjpg&auto=webp&s=1d36479bbd4b1a3b6271d0a402c2ae285a4b9b21)
|
||||
|
||||
Fin
|
||||
|
||||
TL/DR Highlights: They know. They're working on it.
|
||||
|
||||
- Hedge funds entered 2020 with higher than historical leverage.
|
||||
|
||||
- Some very large funds have high leverage and are highly interconnected with financial markets and banks.
|
||||
|
||||
- Some reductions in exposures to U.S. Treasury securities may have been due to hedge funds withdrawing from a specific bond basis trade.
|
||||
|
||||
- Lenders to hedge funds face risks even if such lending is secured, because if a large fund, or many funds, suddenly failed, each counterparty may attempt to sell the collateral in unison, and the value of the collateral could decline materially, imposing losses on counterparties.
|
||||
|
||||
- Large banks' exposures to hedge funds through lending and the significance of these exposures relative to bank assets.
|
||||
|
||||
- Importance of the [SEC's Form PF.](https://www.sec.gov/divisions/investment/pfrd/pfrdfaq.shtml)
|
||||
|
||||
- Acting Chair of the SEC, provided additional information regarding Archegos, including further detail regarding the firm's investments and the SEC's coordination with other regulators
|
||||
|
||||
- SEC staff's presentation was based on newly available data
|
||||
|
||||
~Semper
|
||||
@ -0,0 +1,12 @@
|
||||
I look up "Top Brokers" for GME year to date and Virtu Financial ranks head and shoulders on top. Ranking is similar for AMC. How do i interpret this data? Is Virtu a villain?
|
||||
===============================================================================================================================================================================
|
||||
|
||||
| Author | Source |
|
||||
| :-------------: |:-------------:|
|
||||
| [u/Sti8man7](https://www.reddit.com/user/Sti8man7/) | [Reddit](https://www.reddit.com/r/Superstonk/comments/nr6urb/i_look_up_top_brokers_for_gme_year_to_date_and/) |
|
||||
|
||||
---
|
||||
|
||||
[News 📰 | Media 📱](https://www.reddit.com/r/Superstonk/search?q=flair_name%3A%22News%20%F0%9F%93%B0%20%7C%20Media%20%F0%9F%93%B1%22&restrict_sr=1)
|
||||
|
||||
[](https://i.redd.it/vbvtcglvxz271.jpg)
|
||||
91
Managing-Wealth/2021-04-11-The-Broker-Preparation-Guide.md
Normal file
91
Managing-Wealth/2021-04-11-The-Broker-Preparation-Guide.md
Normal file
@ -0,0 +1,91 @@
|
||||
The Broker Preparation Guide
|
||||
============================
|
||||
|
||||
| Author | Source |
|
||||
| :-------------: |:-------------:|
|
||||
| [u/socrates6210](https://www.reddit.com/user/socrates6210/) | [Reddit](https://www.reddit.com/r/Superstonk/comments/mowzjk/the_broker_preparation_guide/?utm_medium=android_app&utm_source=share) |
|
||||
|
||||
---
|
||||
|
||||
|
||||
[DD 👨🔬](https://www.reddit.com/r/Superstonk/search?q=flair_name%3A%22DD%20%F0%9F%91%A8%E2%80%8D%F0%9F%94%AC%22&restrict_sr=1)
|
||||
|
||||
[](https://preview.redd.it/glaygp8cfls61.jpg?width=612&format=pjpg&auto=webp&s=d3af7f72c3be06af8b4a2076b44ed083be172e6a)
|
||||
|
||||
Following my last post titled [The MOASS Preparation Guide](https://www.reddit.com/r/Superstonk/comments/mm5qle/the_moass_preparation_guide/) I noticed there was a lot of questions around which broker to use. I have taken the time to thrawl through the internet and find out the important questions about popular brokers.
|
||||
|
||||
Here are the things that you need to be cautious of:
|
||||
|
||||
- Did they block trading during the January mini-squeeze?
|
||||
|
||||
- No saying if they will or wont do it again, just some transparency on what to expect should there be a lot of price action again.
|
||||
|
||||
- Who is their clearing firm?
|
||||
|
||||
- Apex Clearing seems to be at the centre of most of the buy restrictions in January. However, they didn't restrict selling.
|
||||
|
||||
- Do they lend your shares?
|
||||
|
||||
- Make sure that you check and opt out of the share lending program of your broker.
|
||||
|
||||
- Do they use CFDs?
|
||||
|
||||
- If you buy a [Contract-for-difference](https://www.investopedia.com/articles/stocks/09/trade-a-cfd.asp) you are not buying the actual stock, and hold no rights as a shareholder.
|
||||
|
||||
What should you do with this information? Not financial advise, but:
|
||||
|
||||
- If they are under Apex clearing i wouldn't wait until D-Day to start FOMO buying
|
||||
|
||||
- If they only offer CFD, then i would be buying shares on a different platform (diversify brokers)
|
||||
|
||||
- If they lend your shares i would contact them immediately to opt out of share lending, and switch from a margin to a cash account if possible.
|
||||
|
||||
*using a phone? swipe left to see full table -->*
|
||||
|
||||
| Broker | Broker Blocked buy (Jan) | Broker Blocked Sell (Jan) | Clearing House | CH Blocked Buy (Jan) | CH Blocked Sell (Jan) | Lends Shares | Is CFD? | Comments |
|
||||
| --- | --- | --- | --- | --- | --- | --- | --- | --- |
|
||||
| Ally | Yes | No | Apex Clearing | Yes | No | yes | No | You need to make a call to Ally to unenroll, customer service reported to be unresponsive |
|
||||
| BMO | No | No | The Clearing House Payments Company | No | No | yes | No | they can loan your shares but only if you had a negative margin balance |
|
||||
| Capital.com | No | No | <https://capital.com/ice-definition> | No | No | No | Yes | |
|
||||
| Citibank | No | No | ? | No | No | ? | ? | |
|
||||
| Degiro | No | No | ? | No | No | No | No | They limit sell orders at +20% of market price, Lending only not enabled on custody account |
|
||||
| Disnat | No | No | ? | No | No | ? | ? | |
|
||||
| E*Trade | Yes | No | E*TRADE Clearing LLC | No | No | Yes | No | Will loan your shares on a margin account. |
|
||||
| Etoro | Yes | No | ? | No | No | No | Only with leverage/shorts | Added a sneaky stop loss that closed many peoples positions, faced convenient outages |
|
||||
| Fidelity | No | No | National Financial Services, LLC | No | No | No | No | |
|
||||
| First Trade | Yes | No | Apex Clearing | Yes | No | Yes (assumed) | ? | |
|
||||
| Freetrade | Yes | Yes | Barclays (unconfirmed) | yes | Yes | No | No | Prevents trading of US Stock |
|
||||
| FutureAdvisor | ? | ? | National Financial Services, LLC | Unknown | Unknown | No (assumed) | No | Owned by BlackRock |
|
||||
| Hargreaves lansdown | Yes | ? | <https://www.hl.co.uk/security-centre/how-safe-is-your-investment> | Unknown | Unknown | No | No | Cut off buying and supposedly prevented limit orders during the January. |
|
||||
| HSBC Invest Direct | No | No | <https://www.gbm.hsbc.com/solutions/markets/derivatives-clearing-services> | No | No | Yes | No | Loans shares on margin account |
|
||||
| IG Brokers | Yes | No | Euroclear | Unknown | Unknown | No | Yes | Assumed that it doesn't lend shares. |
|
||||
| Interactive Brokers | Yes | No | Self-Clearing | Yes | No | Yes | No | increased margin requirements, Blocked clearing for T212, Lend your shares under the Stock Yield Enhancement Program |
|
||||
| M1 Finance | Yes | No | Apex Clearing | Yes | No | Yes | No | email <support@m1finance.com> to opt out of share loaning. |
|
||||
| Merrill Edge/Lynch | Yes | No | Self-Clearing | Yes | No | Yes | No | Contact customer service to check if you're opted in |
|
||||
| Nordnet | No | No | Euronext | No | No | Yes | No | If you have a "investment account Zero / IKZ", you have to OPT-OUT |
|
||||
| Plus500 | No | No | ? | No | No | No | Yes | No longer lists GME to buy, CFD Only |
|
||||
| Public.com | Yes | No | Apex Clearing | Yes | No | yes | ? | fully paid securities lending turn on by default, need to contact customer service. |
|
||||
| Qtrade | No | No | ? | No | No | No | Yes | Set marginrequirements to 100%, Set 1500 sell limit |
|
||||
| Questrade | No | No | self-clearing | No | No | No | No | Need margin account for underlying asset, but they add your shares to the lending pool. |
|
||||
| RBC | No | No | RBC Clearing & Custody | No | No | yes | No | access to RBC Direct Investing had been temporarily unavailable, according to [u/youngpenrose](https://www.reddit.com/u/youngpenrose/) they lend shares. |
|
||||
| Revolut | Yes | No | DriveWealth LCC | Yes | No | No | No | Blames DriveWealth LCC |
|
||||
| RobinHood | Yes | No | Clearing by Robinhood | Yes | No | Yes | No | Need to change to cash account, DON'T USE ROBINHOOD |
|
||||
| Schwab | No | No | Charles Schwab Clearing Services | No | No | Yes | No | Margin Requirements were increased, need to opt out of share lending program. |
|
||||
| SoFi Invest | No | No | Apex Clearing | No | No | Yes | Yes | |
|
||||
| Stake | Yes | No | DriveWealth | Yes | No | ? | No | Blamed DriveWealth, said restrictions not their decision; make sure you opt out of lending. |
|
||||
| Stash | Yes | No | Apex Clearing | Yes | No | Yes | ? | Make sure to opt out of lending. |
|
||||
| TastyWorks | Yes | No | Apex Clearing | yes | No | Yes | No | Need to fill out form to request no lending of shares. |
|
||||
| TD Armitrade | Yes (for margin) | No | TD Ameritrade Clearing, Inc (self-clearing) | No | No | No | Yes | Didn't restrict the purchase of stocks with cash. |
|
||||
| Trade Republic | Yes | No | HSBC Trinkaus & Burkhardt AG | Unknown | Unknown | Yes | ? | [u/SWFninjatomm](https://www.reddit.com/u/SWFninjatomm/) - "sell Limitation of $999999 per Trade " |
|
||||
| Trading212 Invest | Yes | Yes | Interactive Brokers | yes | No | Yes | No | Blames Interactive Brokers for Trade Execution Delay; Can't opt out of lending on Invest. |
|
||||
| Vanguard | No | No | Vanguard Brokerage Services | No | No | No | No | |
|
||||
| Wealth Simple | No | No | Apex Clearing | Yes | No | No | No | |
|
||||
| WeBull | Yes | No | Apex Clearing | Yes | No | Yes | Yes | Can opt out in your settings for share lending. |
|
||||
| Wells Fargo | No | No | Wells Fargo Clearing Services, LLC | No | No | ? | Yes | |
|
||||
| You Invest (JP/Chase) | No | No | J.P. Morgan Clearing Corp (assumed) | No | No | No | No | |
|
||||
|
||||
Note: this list may not be 100% accurate, this was all the information i could find online. Some information I couldn't find easily. If there is any additional brokers you want to see on here, or you see any misinformation please tag me and I will update. this isn't financial advice, do what ever you like with this information.
|
||||
|
||||
TLDR: Check your broker to make sure you don't get left behind when the MOASS happens 🚀Also, if you haven't already, i suggest you [make sure you are prepared](https://www.reddit.com/r/Superstonk/comments/mm5qle/the_moass_preparation_guide/)
|
||||
|
||||
-socrates ( ͡° ͜ʖ ͡°)
|
||||
23
README.md
23
README.md
@ -16,8 +16,21 @@ This repository of GME-related content and relevant information serves two prima
|
||||
|
||||
> Please note most if not all of this content is not my own. All authors and sources are linked at the top of each file, and I encourage you to read the content via the source. There are a lot of intelligent apes who spent copious amounts of time doing their research and deserve your upvote!
|
||||
|
||||
## How to Help
|
||||
Can't find content in wikAPEdia that you think should be archived? Don't hesitate to reach out to me on [Reddit](https://www.reddit.com/user/Meticulous-)!
|
||||
---
|
||||
|
||||
## Key Features
|
||||
|
||||
### Search by Title
|
||||

|
||||
|
||||
### Search by Date
|
||||

|
||||
|
||||
### Browse by Theme
|
||||

|
||||
|
||||
### Save a Copy for Yourself
|
||||

|
||||
|
||||
---
|
||||
|
||||
@ -34,12 +47,13 @@ Can't find content in wikAPEdia that you think should be archived? Don't hesitat
|
||||
| DD | Go/No Go Launch Checklist | [u/nothingbuttherainsir](https://www.reddit.com/user/nothingbuttherainsir/) | [Reddit](https://www.reddit.com/r/Superstonk/comments/nhh0f1/update_go_nogo_for_launch_the_checklist_keeping/) |
|
||||
| DD | Demystifying the Feds ON-RRP | [u/jsmar18](https://www.reddit.com/user/jsmar18/) | [Reddit](https://www.reddit.com/r/Superstonk/comments/oaw2ls/demystify_the_feds_onrrp_operations_why_do_we/) |
|
||||
| DD | MOASS Preparation Guide 2.0 | [u/socrates6210](https://www.reddit.com/user/socrates6210/) | [Reddit](https://www.reddit.com/r/Superstonk/comments/oakqvt/the_moass_preparation_guide_20/) |
|
||||
| Regulations | TLDR of Regulations Update | [u/stevetheimpact](https://www.reddit.com/user/stevetheimpact/) | [Reddit](https://www.reddit.com/r/Superstonk/comments/o5mhie/tldr_regulations_edition_updated_20210622_to/)
|
||||
|
||||
_Check out the [Must-Read](https://github.com/verymeticulous/wikAPEdia/tree/main/Must-Read) section for more important DD_
|
||||
|
||||
---
|
||||
|
||||
## Some People to Look Out For by [u/zedinstead](https://www.reddit.com/u/zedinstead/)
|
||||
## 🦍 Some People to Look Out For by [u/zedinstead](https://www.reddit.com/u/zedinstead/) 🦍
|
||||
|
||||

|
||||
*Banner created by [GameStop](https://twitter.com/GameStop?ref_src=twsrc%5Egoogle%7Ctwcamp%5Eserp%7Ctwgr%5Eauthor)*
|
||||
@ -106,6 +120,9 @@ Quant guy 2 - [u/myplayprofile](https://www.reddit.com/u/myplayprofile/)
|
||||
|
||||
---
|
||||
|
||||
## 🆘 How to Help 🆘
|
||||
Can't find content in wikAPEdia that you think should be archived? Don't hesitate to reach out to me on [Reddit](https://www.reddit.com/user/Meticulous-)!
|
||||
|
||||
### Buy, Hodl, ~~Vote~~ 💎🙌
|
||||
|
||||

|
||||
|
||||
@ -0,0 +1,137 @@
|
||||
FINRA Requests Comment on SHORT INTEREST POSITION REPORTING ENHANCEMENTS & Other Changes Related to SHORT SALE REPORTING (Includes Reporting of Synthetic Shorts): Comments Accepted Until 8/3/2021
|
||||
===================================================================================================================================================================================================
|
||||
|
||||
| Author | Source |
|
||||
| :-------------: |:-------------:|
|
||||
| [u/Freadom6](https://www.reddit.com/user/Freadom6/) | [Reddit](https://www.reddit.com/r/Superstonk/comments/ofmswd/finra_requests_comment_on_short_interest_position/) |
|
||||
|
||||
---
|
||||
|
||||
|
||||
[DD 👨🔬](https://www.reddit.com/r/Superstonk/search?q=flair_name%3A%22DD%20%F0%9F%91%A8%E2%80%8D%F0%9F%94%AC%22&restrict_sr=1)
|
||||
|
||||
Edit 1/3: Formatting
|
||||
|
||||
Edit 2: A lot of comments about self-reporting being the problem. You should read about CAT (Consolidated Audit Trail) going into effect on 9/1. This does appear to be a more automated tracking system for reporting and removes some of the self-reporting features. Here's the link announcing retirement of OATS (Order Audit Trail System) for the CAT: [OATS Retirement - CATS Implementation](https://www.finra.org/filing-reporting/market-transparency-reporting/order-audit-trail-system-oats)
|
||||
|
||||
[Regulatory Notice 21-19](https://www.finra.org/rules-guidance/notices/21-19)
|
||||
|
||||
TL;dr: Above is a Regulatory Notice filed by FINRA on 6/4/2021 with a comment period through 8/3/2021. Document is pretty big, but here is a brief summary of the items that should be paid attention to from what I am seeing, including reporting of SYNTHETIC SHORT POSITIONS.
|
||||
|
||||
This rule change also CALLS out our DD as CORRECT where the sale of a call option and purchase of a put option (where options have the same strike price and expiration date) are being used to HIDE SYNTHETIC SHORTS. This rule is coming across as a pretty important step in proper reporting of short data. Highlights of Notice:
|
||||
|
||||
1. REQUIRING FIRMS TO SUBMIT SYNTHETIC SHORT POSITIONS. Text from rule, "For example, enhanced short interest reporting could include synthetic short positions achieved through the sale of a call option and purchase of a put option (where the options have the same strike price and expiration month) or through other strategies."
|
||||
|
||||
2. FINRA has historically only published short data for OTC securities and not exchange listed securities (definitions below). They now want to report both.
|
||||
|
||||
3. They also want to increase the frequency of reporting this information. Instead of twice per month, now daily or weekly.
|
||||
|
||||
4. Requiring short interest reporting of proprietary and customer accounts.
|
||||
|
||||
5. Making firms report short interest at the account level so FINRA knows the individuals or entities that accumulated short positions.
|
||||
|
||||
6. Jeepers, they are currently allowed to BORROW shares through financing options called "enhanced lending" or "short arranging products" from a firm's domestic or foreign affiliate to "CLOSE OUT" short sales. How is this legal? FINRA wants to make this borrowing included in their short interest reports.
|
||||
|
||||
7. Including Total Shares Outstanding (TSO) and Public Float information in short interest reports.
|
||||
|
||||
8. Adding a new field to short interest report to indicate whether a security is a threshold security.
|
||||
|
||||
9. Reducing processing time by FINRA to disseminate information more quickly after it has been reported.
|
||||
|
||||
10. Daily reporting of Fails-To-Deliver and more stringent reporting requirements.
|
||||
|
||||
Here are a couple of copy/pasted definitions of terms above:
|
||||
|
||||
OTC Security: OTC refers to the process of how securities are traded for companies not listed on a formal exchange. Securities that are traded over-the-counter are traded via a dealer network as opposed to on a centralized exchange. [Define OTC Security](https://www.investopedia.com/terms/o/otc.asp)
|
||||
|
||||
Exchange Listed Securities: A listed security is a [financial instrument](https://www.investopedia.com/terms/f/financialinstrument.asp) that is traded through an exchange, such as the NYSE or Nasdaq. [Define Listed Security](https://www.investopedia.com/terms/l/listedsecurity.asp)
|
||||
|
||||
Threshold Security: Threshold securities are equity securities that have an aggregate fail to deliver position for:
|
||||
|
||||
- Five consecutive settlement days at a [registered clearing agency](https://www.sec.gov/divisions/marketreg/mrclearing.shtml) (e.g., [National Securities Clearing Corporation](https://www.sec.gov/cgi-bin/goodbye.cgi?www.nscc.com/index.html) (NSCC));
|
||||
|
||||
- totaling 10,000 shares or more; and
|
||||
|
||||
- equal to at least 0.5% of the issuer's total shares outstanding. [Define Threshold Security](https://www.investor.gov/introduction-investing/investing-basics/glossary/threshold-securities)
|
||||
|
||||
You know other major players will make comments on this regulatory notice that may cause changes to these regulation changes before implementation. If you are interested, there is a link on the top right of the source webpage to "Submit a Comment". Comments are accepted until 8/3/2021. Remember, any personal information you provide will be made publicly available. - END TL;dr
|
||||
|
||||
Here's some text snippets from the notice from this point forward with no interpretation from myself:
|
||||
|
||||
Background and Discussion
|
||||
|
||||
FINRA is considering whether amendments to its short interest reporting and dissemination program would be appropriate to improve the regulatory and public utility of the information. FINRA also is considering whether any changes to other aspects of its short sale regulatory program would be beneficial, as discussed below.
|
||||
|
||||
A. Publication of Short Interest for Exchange-listed Equity Securities
|
||||
|
||||
FINRA is considering consolidating the publication of short interest data that is reported to FINRA for both listed and unlisted securities. If FINRA were to make this change, short interest files for all equity securities would be made available free of charge on the FINRA website and would not require changes to firms' reporting requirements. In addition, if this change was made, the below potential changes to the content and timing of publicly disseminated data would apply to listed and unlisted securities.
|
||||
|
||||
B. Content of Short Interest Data
|
||||
|
||||
As discussed above, FINRA's website publication of short interest data currently is limited to non-exchange listed, OTC equity securities and includes the following fields:
|
||||
|
||||
- Security name
|
||||
|
||||
- Symbol
|
||||
|
||||
- Settlement Date
|
||||
|
||||
- Market (*i.e.*, OTC equity securities)
|
||||
|
||||
- Current aggregate short interest position for the security across all firms
|
||||
|
||||
- Previous aggregate short interest position for the security across all firms
|
||||
|
||||
- Change in short interest position since the prior reporting period (number of shares)
|
||||
|
||||
- Change in short interest position since the prior reporting period (percentage)
|
||||
|
||||
- Average daily trading volume for the security
|
||||
|
||||
- Days to cover[9](https://www.finra.org/rules-guidance/notices/21-19#_edn9)
|
||||
|
||||
- Revision Flag[10](https://www.finra.org/rules-guidance/notices/21-19#_edn10)
|
||||
|
||||
FINRA is considering the following changes to reported and disseminated short interest data.[11](https://www.finra.org/rules-guidance/notices/21-19#_edn11) In some cases, FINRA also is considering whether the additional data points proposed to be collected should be disseminated publicly or used only for regulatory purposes.
|
||||
|
||||
- Proprietary and Customer Account Categorization: FINRA is considering requiring firms to segregate the total reportable short interest into two categories---short interest held in proprietary accounts and short interest held in customer accounts. Specifically, in addition to reporting the total short interest in a security, firms also would be required to specify the short interest held across all proprietary accounts and across all customer accounts (for both retail customer and institutional customer accounts) for each equity security as of the close of the designated reporting settlement date. FINRA believes that this information would provide beneficial regulatory information regarding the type of market participant that accumulated a short interest position (i.e., a firm or a non-broker-dealer customer).
|
||||
|
||||
- Account-level Position Information: Alternatively, FINRA is considering requiring firms to report (for regulatory purposes only; not to be disseminated publicly) short interest position information with more granularity by reporting at the account level for all equity securities. Account-level short interest position information would provide FINRA with insight into the identity of the individuals or entities that accumulated concentrations of large short interest positions, which FINRA would use to enhance its reviews for compliance both with SEC Regulation SHO and FINRA's short sale rules.
|
||||
|
||||
- Synthetic Short Positions: In addition, FINRA is considering requiring firms to reflect synthetic short positions in short interest reports. For example, enhanced short interest reporting could include synthetic short positions achieved through the sale of a call option and purchase of a put option (where the options have the same strike price and expiration month) or through other strategies. FINRA believes this information would assist FINRA in understanding the scope of market participants' short sale activity, specifically regarding the use of less-traditional means of establishing short interest.
|
||||
|
||||
- Loan Obligations Resulting From Arranged Financing: FINRA understands that members may offer arranged financing programs (sometimes called "enhanced lending" or "short arranging products") through which a customer can borrow shares from the firm's domestic or foreign affiliate and use those shares to close out a short position in the customer's account. FINRA is considering requiring members to report as short interest outstanding stock borrows by customers in their arranged financing programs to better reflect actual short sentiment in the stock.
|
||||
|
||||
- Total Shares Outstanding (TSO) and Public Float: FINRA also is considering including in FINRA-disseminated short interest data, where available, the TSO and public float for securities. FINRA would obtain this information from a third-party source and include it in disseminated information; therefore, this change would not alter firms' reporting requirements. FINRA believes disseminating a security's TSO and public float would provide investors with contextual information regarding the relative size of the aggregate short position in the security.
|
||||
|
||||
- Threshold Security Field:[12](https://www.finra.org/rules-guidance/notices/21-19#_edn12) FINRA is considering including in FINRA-disseminated short interest data a new field that would indicate if the security is a threshold security as of the short interest position reporting settlement date. This change would not alter firms' reporting requirements. FINRA believes that a security's status as a threshold security could be useful to investors and other market participants in evaluating an investment decision, and that consolidating this information into disseminated short interest data simplifies the process of obtaining this information for users of the data.
|
||||
|
||||
C. Frequency and Timing of Short Interest Position Reporting and Data Dissemination
|
||||
|
||||
Members currently must submit short interest reports to FINRA twice a month and reports are due to FINRA by 6:00 p.m. ET on the second business day after the reporting settlement date designated by FINRA. FINRA is considering requiring firms to report short interest data to FINRA more frequently. Specifically, FINRA is considering reducing the reporting timeframe to daily or weekly submissions and, to enable FINRA to disseminate the collected information to the marketplace on a timelier basis, such reports also would be due to FINRA in a shorter timeframe following the applicable settlement date. For example, if FINRA were to require daily submissions, short interest reports could be due by 6:00 p.m. ET one business day after the designated reporting settlement date, and for weekly submissions, short interest reports could be due by 6:00 p.m. ET one business day after the weekly designated reporting settlement date (instead of the current requirement of two business days after the designated reporting settlement date).[13](https://www.finra.org/rules-guidance/notices/21-19#_edn13)
|
||||
|
||||
FINRA also is considering reducing the FINRA processing time involved in disseminating short interest data. Currently, FINRA disseminates short interest data for OTC equity securities on the FINRA website seven business days after the designated settlement date, which is five business days after the reports are due from member firms. FINRA is considering reducing this processing time. The proposed reduction in FINRA processing time could apply where firms report short interest to FINRA on a daily or weekly basis, as described above, and also could apply to the current twice a month reporting cycle (with or without a reduced firm turnaround time).
|
||||
|
||||
D. Information on Allocations of Fail-to-Deliver Positions
|
||||
|
||||
Regulation SHO permits a member that is a participant of a registered clearing agency to allocate a portion of its Rule 204 fail-to-deliver position to another broker-dealer based on that other broker-dealer's short position.[14](https://www.finra.org/rules-guidance/notices/21-19#_edn14) FINRA is considering enhancing its short sale reporting program by adopting a new rule to require members to submit to FINRA (for regulatory purposes only; not for public dissemination) a report of daily allocations of fail-to-deliver positions to correspondent firms pursuant to Rule 204(d) of Regulation SHO.
|
||||
|
||||
The proposed allocation report may include the following fields:
|
||||
|
||||
- Security
|
||||
|
||||
- Identity of correspondent firm
|
||||
|
||||
- Amount allocated to correspondent firm (number of shares)
|
||||
|
||||
- Trade date(s)
|
||||
|
||||
- Allocation Date
|
||||
|
||||
- Close out Date
|
||||
|
||||
- Applicable close out obligation (T+3, T+5 or T+35)
|
||||
|
||||
Th-th-th-that's all folks!
|
||||
|
||||
Tanks fo' readin'
|
||||
45
Regulations/2021-07-08-Regulation-PDFs.md
Normal file
45
Regulations/2021-07-08-Regulation-PDFs.md
Normal file
@ -0,0 +1,45 @@
|
||||
# List of Regulations and their PDFs
|
||||
|
||||
---
|
||||
|
||||
## Regulations
|
||||
|
||||
| Regulation | Description | Date Effective | PDF |
|
||||
| :-------------: |:-------------| :-------------:| :-------------:|
|
||||
| **DTC** | **The Depository Trust Company is a subsidiary of the DTCC, and was created to reduce costs and provide clearing and settlement efficiencies.** [[1]](https://www.dtcc.com/about/businesses-and-subsidiaries/dtc) | | **[Regulatory Rule Filings](https://www.dtcc.com/legal/sec-rule-filings?subsidiary=DTC&pgs=1)** |
|
||||
| SR-DTC-2021-003 | Changes the risk/margin reporting period from monthly to daily. | ✅ 2021-03-16 | [SR-DTC-2021-003-Approval-Notice.pdf](https://github.com/verymeticulous/wikAPEdia/files/6784840/SR-DTC-2021-003-Approval-Notice.pdf)|
|
||||
| SR-DTC-2021-004 | Outlines procedures for asset liquidation in the event of a defaulting member. | ✅ 2021-03-16 | [SR-DTC-2021-004.pdf](https://github.com/verymeticulous/wikAPEdia/files/6784834/SR-DTC-2021-004.pdf) |
|
||||
| SR-DTC-2021-005 | Prevents loaned/borrowed shares from being loaned/borrowed more than once. | ✅ 2021-06-25 | [SR-DTC-2021-005.pdf](https://github.com/verymeticulous/wikAPEdia/files/6784788/SR-DTC-2021-005.pdf) |
|
||||
| SR-DTC-2021-006 | Removes the old method of asset tracking in favor of SR-DTC-2021-005. | ✅ 2021-04-21 | [SR-DTC-2021-006.pdf](https://github.com/verymeticulous/wikAPEdia/files/6784830/SR-DTC-2021-006.pdf) |
|
||||
| SR-DTC-2021-007 | Eliminates the APO system in favor of the Claim Connect system for fee reconciliation between parties. **Mandatory 2021-07-09** | ✅ 2021-04-30 | [SR-DTC-2021-007.pdf](https://github.com/verymeticulous/wikAPEdia/files/6784828/SR-DTC-2021-007.pdf) |
|
||||
| SR-DTC-2021-008 | Reorganizes existing tax reporting/withholdingg guides to accomodate for various DTCC procedural changes that have been implemented.| ✅ 2021-06-08 | [SR-DTC-2021-008.pdf](https://github.com/verymeticulous/wikAPEdia/files/6784823/SR-DTC-2021-008.pdf) |
|
||||
| SR-DTC-2021-009 | Changes current procedures to clearly define deadlines in order to eliminate existing delay-loop workarounds. | ✅ 2021-06-16 | [SR-DTC-2021-009.pdf](https://github.com/verymeticulous/wikAPEdia/files/6784808/SR-DTC-2021-009.pdf) |
|
||||
| **ICC** |**The ICE Clear Credit was founded to digitize markets and provide greater price transparency.** [[1]](https://www.theice.com/about) | | **[Regulatory Rule Filings](https://www.sec.gov/rules/sro/icc.shtml)** |
|
||||
| SR-ICC-2021-005 | ICC version of SR-DTC-2021-004 to define procedures for asset liquidation in the event of a defaulting member. | ✅ 2021-05-10 | [SR-ICC-2021-005.pdf](https://github.com/verymeticulous/wikAPEdia/files/6784935/SR-ICC-2021-005.pdf) |
|
||||
| SR-ICC-2021-007 | Redefines what can and cannot be considered collateral, reducing overall capital on books and lowering acceptable risk ceilings. | ✅ 2021-05-13| [SR-ICC-2021-007.pdf](https://github.com/verymeticulous/wikAPEdia/files/6784931/SR-ICC-2021-007.pdf) |
|
||||
| SR-ICC-2021-008 | Redefines how risky collateral is handled in Credit Default Swaps. Increases initial margin requirements, and lowers ICC exposure. | ✅ 2021-05-18 | [SR-ICC-2021-008.pdf](https://github.com/verymeticulous/wikAPEdia/files/6784924/SR-ICC-2021-008.pdf) |
|
||||
| SR-ICC-2021-009 | Charges calculation of risk from using month-to-month averages to using day-to-day-averages. | ✅ 2021-05-20 | [SR-ICC-2021-009.pdf](https://github.com/verymeticulous/wikAPEdia/files/6784922/SR-ICC-2021-009.pdf) |
|
||||
| SR-ICC-2021-014 | Defines fee schedules for the 2nd half of 2021; includes reduced fees on CDS (25%) and incentives for risk sharing.| ✅ 2021-05-18 | [SR-ICC-2021-014.pdf](https://github.com/verymeticulous/wikAPEdia/files/6784919/SR-ICC-2021-014.pdf) |
|
||||
| **OCC** | **The Office of the Comptroller of the Currency is a federal agency that oversees the execution of laws relating to national banks.** [[1]](https://www.investopedia.com/terms/o/office-comptroller-currency-occ.asp#:~:text=The%20Office%20of%20the%20Comptroller%20of%20the%20Currency%20(OCC)%20is,laws%20relating%20to%20national%20banks.) | | **[Regulatory Rule Filings](https://www.sec.gov/rules/sro/occ.htm)** |
|
||||
| SR-OCC-2021-003 | Increases margin requirements for market makers when dealing with options contracts. | ✅ 2021-05-27 | [SR-OCC-2021-003.pdf](https://github.com/verymeticulous/wikAPEdia/files/6784888/SR-OCC-2021-003.pdf) |
|
||||
| SR-OCC-2021-004 | Allows previosuly excluded firms to participate in auctions of assets when a member is liquidated. | ✅ 2021-05-19 | [SR-OCC-2021-004.pdf](https://github.com/verymeticulous/wikAPEdia/files/6784904/SR-OCC-2021-004.pdf) |
|
||||
| **NSCC** | **The National Securities Clearing Corporation is a subsidiary of the DTCC, and was created to provide clearing settlement, risk managment, central counterparty services, and a guarantee of completion for certain transactions for virtuall all broker-to-broker trades.** [[1]](https://www.dtcc.com/about/businesses-and-subsidiaries/nscc) | | **[Regulatory Rule Filings](https://www.dtcc.com/legal/sec-rule-filings?subsidiary=NSCC&pgs=1)** |
|
||||
| SR-NSCC-2021-002 | Automates the margin call process when daily reports indicate a member is overleveraged. | ✅ 2021-06-23 | [SR-NSCC-2021-002.pdf](https://github.com/verymeticulous/wikAPEdia/files/6784875/SR-NSCC-2021-002.pdf) |
|
||||
| SR-NSCC-2021-004 | NSCC version of SR-DTC-2021-004 to define procedures for asset liquidation in the event of a defaulting member. | ✅ 2021-03-18 | [SR-NSCC-2021-004.pdf](https://github.com/verymeticulous/wikAPEdia/files/6784872/SR-NSCC-2021-004.pdf) |
|
||||
| SR-NSCC-2021-005 | Increases the minimum required fund deposit for DTCC members from $10,000 to $250,000 each. | ⚠️ TBD (2021-08-12) | [SR-NSCC-2021-005.pdf](https://github.com/verymeticulous/wikAPEdia/files/6784869/SR-NSCC-2021-005.pdf) |
|
||||
| SR-NSCC-2021-006 | Removal of the 10-day approval period on proposed rule changes among other numerous ammendments. | ✅ 2021-05-12 | [SR-NSCC-2021-006.pdf](https://github.com/verymeticulous/wikAPEdia/files/6784867/SR-NSCC-2021-006.pdf) |
|
||||
| **Other** | | | |
|
||||
| Exchange Act Rule 15c3-3 | Establishes a requirement for 100% collateral to be held on all positions within six months. | ✅ 2021-04-22 | [Rule-15c3-3.pdf](https://github.com/verymeticulous/wikAPEdia/files/6784958/Rule-15c3-3.pdf) |
|
||||
| MSBS978-21: FICC Notice | Returns MBSD Intraday Mark-Market Charge to hourly assessment istead of once-per-day for margins. | ✅ 2021-05-03 | [MBSD978-21.pdf](https://github.com/verymeticulous/wikAPEdia/files/6784986/MBSD978-21.pdf) |
|
||||
| SR-NYSEAMER-2021-29 | Provides incentives for brokers to route retail orders through the NYSE instead of through dark pools/off-market exchanges (OTC). | ✅ 2021-06-17 | [SR-NYSEAMER-2021-29.pdf](https://github.com/verymeticulous/wikAPEdia/files/6784991/SR-NYSEAMER-2021-29.pdf) |
|
||||
| FINRA Regulatory Notice 21-19 | Requires firms to submit synthetic short positions with increased reporting frequency tfrom twice per month to daily or weekly. | ⚠️ TBD (Comments accepted until 2021-08-03) | [Regulatory-Notice-21-19.pdf](https://github.com/verymeticulous/wikAPEdia/files/6784777/Regulatory-Notice-21-19.pdf) |
|
||||
|
||||
**Sources**
|
||||
1. [TLDR of Regulations](https://www.reddit.com/r/Superstonk/comments/o5mhie/tldr_regulations_edition_updated_20210622_to/)
|
||||
2. [Go / No Go Launch Checklist](https://www.reddit.com/r/Superstonk/comments/nhh0f1/update_go_nogo_for_launch_the_checklist_keeping/)
|
||||
3. [FINRA Short Interest Position Reporting Enhancements](https://www.reddit.com/r/Superstonk/comments/ofmswd/finra_requests_comment_on_short_interest_position/)
|
||||
|
||||
---
|
||||
**Relevant Information/Material**
|
||||
|
||||
_For more information on Regulations, check out [wikAPEdia](https://github.com/verymeticulous/wikAPEdia/tree/main/Regulations)_
|
||||
@ -0,0 +1,14 @@
|
||||
TL;DR: Regulations Edition [Updated 2021-06-22 to include the approval of SR-NSCC-2021-002]
|
||||
===========================================================================================
|
||||
|
||||
| Author | Source |
|
||||
| :-------------: |:-------------:|
|
||||
| [u/stevetheimpact](https://www.reddit.com/user/stevetheimpact/) | [Reddit](https://www.reddit.com/r/Superstonk/comments/o5mhie/tldr_regulations_edition_updated_20210622_to/) |
|
||||
|
||||
---
|
||||
|
||||
[Education 👨🏫 | Data 🔢](https://www.reddit.com/r/Superstonk/search?q=flair_name%3A%22Education%20%F0%9F%91%A8%E2%80%8D%F0%9F%8F%AB%20%7C%20Data%20%F0%9F%94%A2%22&restrict_sr=1)
|
||||
|
||||

|
||||
|
||||

|
||||
@ -0,0 +1,78 @@
|
||||
Elliott Waves and The Top Of The Market, Is This THE TOP?
|
||||
=========================================================
|
||||
|
||||
| Author | Source |
|
||||
| :-------------: |:-------------:|
|
||||
| [u/possibly6](https://www.reddit.com/user/possibly6/) | [Reddit](https://www.reddit.com/r/Superstonk/comments/obn6rx/elliott_waves_and_the_top_of_the_market_is_this/?utm_source=share&utm_medium=web2x&context=3) |
|
||||
|
||||
---
|
||||
|
||||
[DD 👨🔬](https://www.reddit.com/r/Superstonk/search?q=flair_name%3A%22DD%20%F0%9F%91%A8%E2%80%8D%F0%9F%94%AC%22&restrict_sr=1)
|
||||
|
||||
Sup Apes
|
||||
|
||||
not financial advice
|
||||
|
||||
super brief post, I've received so many pings this AM I wanted to address it in a formal post.
|
||||
|
||||
the original post is here: <https://www.reddit.com/r/Superstonk/comments/o02fnr/elliot_waves_gme_the_sp_500_wen_market_peak_and/?utm_source=share&utm_medium=web2x&context=3>
|
||||
|
||||
I've seen a lot of chatter regarding my post saying SPY would peak around 430, and I wanted to add a few more targets for your viewing pleasure.
|
||||
|
||||
In that post, I believe I gave a target of around high 429, though there are multiple levels to watch out for. Remember, Elliott Wave gives us multiple targets, as we are analyzing many different time frames.
|
||||
|
||||
Outlined for your convenience:
|
||||
|
||||
[](https://preview.redd.it/jhtm62381m871.png?width=2780&format=png&auto=webp&s=b0ccbc59d4550218f31d0ada2c8d8761200d336f)
|
||||
|
||||
1hr
|
||||
|
||||
I'm gonna zoom out so you can see the super cycle 5 target, as I believe this to be the most valid/important level. I got this target by measure waves 1-3 and bringing the extension down to the low of 4 (covid flash crash).
|
||||
|
||||
First level is the .618 level, next target being the .786.
|
||||
|
||||
The .618 level was passed long ago, narrowing our top end super cycle target at 432.08 (blue line):
|
||||
|
||||
[](https://preview.redd.it/4o3ox7l42m871.png?width=2764&format=png&auto=webp&s=573f48c86294ac2066831fcda390b8e890b2893b)
|
||||
|
||||
super cycle from end of 08
|
||||
|
||||
clearly, even though i have a shit ton of borderline aneurism inducing levels, it looks like we are running out of steam.
|
||||
|
||||
Just for fun, I went and analyzed the grand super cycle of SPX, as the grand super cycle dates back to the low of the great depression (roaring twenties)
|
||||
|
||||
super briefly, just look and take from the image what you will.
|
||||
|
||||
[](https://preview.redd.it/ewer0klg2m871.png?width=2788&format=png&auto=webp&s=0a3a3ed9d875ef9392951f7c990e7c448e877105)
|
||||
|
||||
monthly
|
||||
|
||||
IDK about you, but me thinks the music is about to stop.
|
||||
|
||||
in the first image, I provided a few targets as I am measure multiple different "cycles" if you will, all of which are point to a high around low to mid 430s.
|
||||
|
||||
There is no "magic level" per se, but fibs are not wrong. They are nature in essence, the golden ratio is everywhere.
|
||||
|
||||
After hitting our peak, my guess is around 432 should the peak not be today (nothing surprises me anymore) we begin our slow bleed. I do believe Gamestop among many other catalyst will cause a relatively harsh "A" wave if you will, on SPY it will likely drop to at least 345 before any significant buy pressure comes back, though this point would be the "B" wave. the fakeout. media will likely say the crash is over and its okay to buy. SPY won't dip that hard. come on. be realistic.
|
||||
|
||||
LIES!
|
||||
|
||||
I believe SPY will come back to at least 250, timeframe for this is really hard to gauge, but based on previous bear markets, I'd guess at least a 2 year bear market.
|
||||
|
||||
Though we also haven't had an event quite like this before, so as to how long the bear market will ensue, that's anyone's guess.
|
||||
|
||||
Given this is our Grand Super cycle completing from the low of the roaring twenties, it really is not crazy to think that we can (and likely will) correct 50% of that move.
|
||||
|
||||
IE, it is TOTALLY POSSIBLE for SPX (not spy) to drop down to around 2200 before beginning to recover.
|
||||
|
||||
[](https://preview.redd.it/805vzcbw3m871.png?width=2758&format=png&auto=webp&s=feb08ec4cc03935410f6240a547d5bb245068243)
|
||||
|
||||
SPX
|
||||
|
||||
I'll leave you with this. I won't theorize too much on the events that will cause this, I believe everyone has a pretty solid idea of whats about to happen. I just want to lay out the technicals, and how I PERSONALLY believe this will play out. I can be 100% wrong as can anyone else.
|
||||
|
||||
Be well.
|
||||
|
||||
It's cynical, but I'm jacked.
|
||||
|
||||
TLDR: market peak close, market will fall hard soon. Media will likely say crash is over at the "B" phase of the correction wherein we rebound a bit. Don't fall for it. GME go BOOM soon 🚀
|
||||
@ -0,0 +1,91 @@
|
||||
GME: The Powder Keg Ready to Explode
|
||||
====================================
|
||||
|
||||
| Author | Source |
|
||||
| :-------------: |:-------------:|
|
||||
| [u/RocketTraveler](https://www.reddit.com/user/RocketTraveler/) | [Reddit](https://www.reddit.com/r/Superstonk/comments/obteg7/gme_the_powder_keg_ready_to_explode/) |
|
||||
|
||||
---
|
||||
|
||||
|
||||
[Education 👨🏫 | Data 🔢](https://www.reddit.com/r/Superstonk/search?q=flair_name%3A%22Education%20%F0%9F%91%A8%E2%80%8D%F0%9F%8F%AB%20%7C%20Data%20%F0%9F%94%A2%22&restrict_sr=1)
|
||||
|
||||
Hey all,
|
||||
|
||||
GME is a massive powder keg about to explode. Curious? Read on to find out more...
|
||||
|
||||
A very reliable technical indicator created by Rocky Outcrop is flashing a rare signal that cannot be ignored.
|
||||
|
||||
Full credit goes to Rocky Outcrop and Trade Spotting for creating this custom DMI indicator and sharing it with the masses.
|
||||
|
||||
TLDR
|
||||
|
||||
- The Directional Movement Index (DMI) started flashing a powder keg signal on June 29th. This signal has only flashed three other times in all of 2021
|
||||
|
||||
- The ignition source of the signal (the ADX line) is at it's fourth lowest point since 2018. The lower the ADX goes, the more certain we can be of a near-future run-up
|
||||
|
||||
- When the powder keg explodes, expect volatility and momentum to skyrocket
|
||||
|
||||
DMI
|
||||
|
||||
The Directional Movement Index (or DMI for short) is a technical indicator made up of three components:
|
||||
|
||||
- DI+: This shows the current momentum of positive price movement. This is shown in YELLOW on my charts below
|
||||
|
||||
- DI-: This shows the current momentum of negative price movement. This is shown in PINK on my charts below
|
||||
|
||||
- ADX (Average Directional Index): This shows the *strength* of the current price movement. This is shown in BLUE on my charts below (crossover points denoted in orange)
|
||||
|
||||
The powder keg signal: When the DI+ and DI- lines converge (come together) AND the ADX line is simultaneously at a low point, the powder keg is lit. This is denoted by a gray background highlight on the charts below
|
||||
|
||||
Without further ado, here are the charts:
|
||||
|
||||
Current Price Action
|
||||
|
||||
[](https://preview.redd.it/lklugrdlhn871.png?width=1032&format=png&auto=webp&s=4678d387e3ac1f692432e9117266407ce291cd1c)
|
||||
|
||||
Current Price Action. DMI Power Keg lit as of June 29th
|
||||
|
||||
Above shows our current price action over the last 6 weeks. As we have been consolidating from June 9th, the DI+ and DI- lines have converged and the ADX is at an extreme low. Notice the powder keg signal flashing (light grey box) as of June 29th.
|
||||
|
||||
Historical Price Action
|
||||
|
||||
[](https://preview.redd.it/tsvvhn7mln871.png?width=1098&format=png&auto=webp&s=c88a922bbf50331713f897de4995ba44ac13a078)
|
||||
|
||||
Historical Price Action. Multiple Signals Flashing over 2021
|
||||
|
||||
This is only the 4th time this entire year the DMI powder keg has been lit
|
||||
|
||||
- The first signal was flashed at the end of February roughly 1 week before our huge run-up from $40 to $350
|
||||
|
||||
- The second and third signals were flashed together roughly 2 weeks before our May run-up from $140 to $350
|
||||
|
||||
- The fourth signal just started flashing on June 29th. This would indicate a huge move up in the next 1-2 weeks. Run-up to commence from $200 to ???
|
||||
|
||||
Bonus Chart
|
||||
|
||||
[](https://preview.redd.it/m19pl7zxjn871.png?width=1538&format=png&auto=webp&s=56a9d0a9096ea3b1dd860b035d812d0c5455a879)
|
||||
|
||||
Historical ADX Data
|
||||
|
||||
Bonus chart!
|
||||
|
||||
The ADX is the fuse that ultimately ignites everything as it shows the current momentum has stalled and volatility is ready to pick back up again.
|
||||
|
||||
Since 2018 the ADX has only ever been this low THREE OTHER TIMES. The most recent low point is happening right now! Historically speaking, GME is in a situation where it is ready to explode any day.
|
||||
|
||||
Footnote
|
||||
|
||||
For those who believe TA is invalid on GME and other SHF-manipulated stocks, I respect your opinion.
|
||||
|
||||
My opinion? TA is not the holy grail by any means, but it is still valid on GME.
|
||||
|
||||
Why? Because TA relies heavily on human patterns and emotions as they relate to stock prices. GME is no exception. There are still support and resistance levels like everything else.
|
||||
|
||||
Yes there is no denying GME is heavily manipulated, but that doesn't change the larger philosophy TA is based on.
|
||||
|
||||
Remember, TA is not a crystal ball but it does offer a glimpse into the most likely outcome.
|
||||
|
||||
To each his/her own.
|
||||
|
||||
*I am not a financial advisor and this is not financial advice*
|
||||
@ -0,0 +1,132 @@
|
||||
Elliott Waves, GME, WEN THE F*CK MOON!? 🚀
|
||||
==========================================
|
||||
|
||||
| Author | Source |
|
||||
| :-------------: |:-------------:|
|
||||
| [u/possibly6](https://www.reddit.com/user/possibly6/) | [Reddit](https://www.reddit.com/r/Superstonk/comments/of4zjh/elliott_waves_gme_wen_the_fck_moon/) |
|
||||
|
||||
---
|
||||
|
||||
[DD 👨🔬](https://www.reddit.com/r/Superstonk/search?q=flair_name%3A%22DD%20%F0%9F%91%A8%E2%80%8D%F0%9F%94%AC%22&restrict_sr=1)
|
||||
|
||||
Sup apes
|
||||
|
||||
not financial advice in the slightest.
|
||||
|
||||
Before I begin this analysis post, if you question the validity of fibonacci and Elliott Wave because it has proven to be "incorrect" you are approaching this topic with the wrong mindset. Fibonacci and EW are quite literally the "formula" to the stock market, but its much easier to understand than it is to implement.
|
||||
|
||||
GET FUCKING HYPEEEE!!!!
|
||||
|
||||
Obligatory crank: <https://www.youtube.com/watch?v=Phy75VJRObQ>
|
||||
|
||||
Spotify link: <https://open.spotify.com/track/21UoRIOIjkWdHU8xbxQ0Z7?si=1958348bf5524bf0>
|
||||
|
||||
As always, I post intraday analysis on my [twitter](https://twitter.com/gavinmayreal) to provide updates on what I see, if you're interested in the snippets/BTS charting, you'll love it.
|
||||
|
||||
In this post I am going to be going over mainly GME and touch on a few indices.
|
||||
|
||||
First off, if you've been reading my posts for a while, you'd know I was on the lookout for the current trend to hold above 197 for my wave count to be correct. Friday and today we broke below this level, seeing a low of 193.71.
|
||||
|
||||
Wut mean you ask?
|
||||
|
||||
All this means is that the count I was analyzing on a smaller scale was invalidated, as we broke below the original supposed low target of 197.
|
||||
|
||||
In lehman's terms, instead of a 3 within a 3 within a 3 within a 3, the updated trend will be a 1 within a 3 within a 3 within a 3.
|
||||
|
||||
basically, nothing is changed.
|
||||
|
||||
I am also very well aware that bad actors read my and other's analysis and act on it as an attempt to attack the validity of not only technical analysis but members of the sub that are looked up to for their analysis.
|
||||
|
||||
To the shorts that do this, I say fuck you, pay me.
|
||||
|
||||
I have happily added more shares under 200, that's a fucking steal if you ask me.
|
||||
|
||||
Here's my updated chart factoring in today's low, simplified (I cleaned my shit up big time)
|
||||
|
||||
[](https://preview.redd.it/lq89qnsfqn971.png?width=2816&format=png&auto=webp&s=720f08ff3a540599c47662db4299584baef44abc)
|
||||
|
||||
Daily
|
||||
|
||||
Note, the only targets changed from the recent downward pressure (white line/red annotation). All larger scale targets remain the same, the only way the latter would be invalidated is if we broke below 112.83 (yellow line target) and 38 (blue line target)
|
||||
|
||||
The white (3rd largest degree) will go down proportionate to how much downside we have from hereon out. example, the 1.618:1 ideal wave 3 target factoring in today's low of 193 comes out to 567.66. If we drop to a low of 190 in the next few days before continuing up, then the updated 3 target would be 564.66.
|
||||
|
||||
My biggest reason for writing this is to clear up some misconceptions I have heard regarding the wave structure.
|
||||
|
||||
So idk about you, but I could care less about what happens in the short term. The overarching setup is (as always) screaming buy.
|
||||
|
||||
However, in terms of my previous prediction of 197 being the low, this fell through as we broke below the smaller scale wave 1 low. Remember, for a motive (5 wave impulse) structure, wave 2 cannot retrace into the territory of your wave 1, otherwise you must redraw. There is NO exception for this rule.
|
||||
|
||||
Before I continue with GME, I would like to shed more light on my [$SPY analysis ](https://www.reddit.com/r/Superstonk/comments/obn6rx/elliott_waves_and_the_top_of_the_market_is_this/?utm_source=share&utm_medium=web2x&context=3). I still hold my 432 top target, I just want to go a bit deeper in the analysis. I was considering making another youtube video so you could see how I analyze and draw targets, but I'll save that for another time. I do want to thank you all for the insane amount of support on my first (and only) [GME SPY EW video ](https://www.reddit.com/r/Superstonk/comments/o1j93q/a_message_from_elliot_waves_guy/?utm_source=share&utm_medium=web2x&context=3)
|
||||
|
||||
Here's what I see on a 4hr view:
|
||||
|
||||
[](https://preview.redd.it/wf4gw34otn971.png?width=2782&format=png&auto=webp&s=20c654cb312a1b3823a203fdde519bc7a26c9d94)
|
||||
|
||||
4hr
|
||||
|
||||
Monthly:
|
||||
|
||||
[](https://preview.redd.it/51ovbhfstn971.png?width=2772&format=png&auto=webp&s=11191e09c072e0d761c6d48e487db233da740945)
|
||||
|
||||
Monthly
|
||||
|
||||
Without a doubt, SPY is ridiculously extended to the upside.
|
||||
|
||||
I believe we will see 436 hit in the near future at the very least, highly doubt much more upside from there. My reasoning for this is remember that EW is a fractal trading strategy, meaning targets on a smaller timeframe line up to form larger time frame targets.
|
||||
|
||||
[](https://preview.redd.it/51mjqx85un971.png?width=2824&format=png&auto=webp&s=e6549eb2b289e18c38c3e5965405607447805b86)
|
||||
|
||||
visualized
|
||||
|
||||
You can see the 5 wave structure from the recent lowest low, normally wave 4 can't retrace into the territory of 1, however keep in mind the overarching wave is a 5, meaning 4 CAN retrace into the territory of 1. This trips a lot of new EW traders up as they don't understand the rule of diagonals.
|
||||
|
||||
regardless, wave 5 usually targets .618 - .786 of 1. the .618 level of this move comes out to 436, where the bigger cycle 5 next target comes out to 436 as well (1:1 level, yellow).
|
||||
|
||||
an extension of above .786 for a wave 5 is considered to be extended for what it's worth. The yellow trajectory I drew is only for visualization purposes and in no way is saying this is exactly how SPY will play out in relation to price/time.
|
||||
|
||||
the reason I'm talking so much about SPY here is because GME and a little something called negative beta. in short, market go down, GME go up, and vise vera, though correlation does not mean causation all the time. The market being near the top and GME near/at the bottom of the trend is interesting when you compare the two, and the supposed trajectory of each from hereon out using EW:
|
||||
|
||||
[](https://preview.redd.it/kyv6eatvun971.png?width=2782&format=png&auto=webp&s=1983cec53b01236137008a1039415c226380dda2)
|
||||
|
||||
visualized
|
||||
|
||||
again, do note the white lines on SPY are only for visualization purposes, see my SPY DD for in depth retracement targets for our seemingly imminent bear market.
|
||||
|
||||
SPY near top and GME near bottom, hmmmm...
|
||||
|
||||
In terms of GME downside should this not be the bottom, super dumbed down, here's the channel GME is traveling in with fib dates worth keeping an eye on:
|
||||
|
||||
[](https://preview.redd.it/6uei55gevn971.png?width=2792&format=png&auto=webp&s=20b232cd208d12dcd1a0c33f885f697d41cf446d)
|
||||
|
||||
channel in red, time extensions colorful
|
||||
|
||||
Fibonacci time extensions can also be used to predict when a wave will change trajectory. In this scenario, I measured the length of the 1 (from 113 to 344) to get fibonacci numbers in relation to this time period. Stocks often need to cool off/consolidate after big moves before continuing the original trajectory. Totally normal in the stock market.
|
||||
|
||||
However, given that GME is incredibly manipulated, take these fib dates with a grain of salt. I personally don't use them often with GME, though on other tickers I have found it to be quite profitable. Not that I endorse GME day trading at all, because you shouldn't, though when trading NORMAL (key word) tickers, Ideally, when swing trading, you load a full position a bit after the first upwards move, and use fib time extensions to predict when the corrective wave will end.
|
||||
|
||||
In this scenario, the 38.2 time extension comes out to tomorrow, which signals a potential reversal coming tomorrow. Wednesday is also notorious for erratic GME movement, so stay buckled up!
|
||||
|
||||
What's realllllllly fucking interesting is the 50% time extension comes on the notorious 7/14 date.
|
||||
|
||||
What I want you to take away from the above visual is in the event that our reversal doesn't begin tomorrow from today's low, lower bound of the channel comes out to around 175. Just keep an eye on that level for some insane cheapies if Shitadel decides to abusively press the short button.
|
||||
|
||||
All in all, GME is incredible bullish and those that hodl through this wave 2 will be handsomely rewarded. This I can guarantee. Fibs don't lie.
|
||||
|
||||
What make's me think today COULD be the low is, you guessed it, significant fib levels. This time, I measured the low of february to the high of march (second highest degree of waves), visualized:
|
||||
|
||||
[](https://preview.redd.it/2qrmj1fuwn971.png?width=2768&format=png&auto=webp&s=131324b10245d06fae1396aa73c6366854c49b3a)
|
||||
|
||||
4hr
|
||||
|
||||
Fib level? 193.5. Today's low? 193.71.
|
||||
|
||||
so close to .69 :')
|
||||
|
||||
Until we have significant upwards pressure, I won't have narrowed down smaller timeframe upside targets, but larger timeframe targets are still valid. It will be very hard to break the overarching setup for the shorts.
|
||||
|
||||
I'm out. Thanks for reading 🍌
|
||||
|
||||
Time to go get high af and stare at fib levels some more.
|
||||
|
||||
TLDR: Boom soon, Market near/at peak, GME at/near bottom, negative beta, GME to 8+ figures is not a meme and will happen if you believe and hodl for it. I know I will 🚀
|
||||
@ -0,0 +1,127 @@
|
||||
GME TA: Why I'm JACKED about today's drop!
|
||||
==========================================
|
||||
|
||||
| Author | Source |
|
||||
| :-------------: |:-------------:|
|
||||
| [u/RocketTraveler](https://www.reddit.com/user/RocketTraveler/) | [Reddit](https://www.reddit.com/r/Superstonk/comments/oftiz8/gme_ta_why_im_jacked_about_todays_drop/) |
|
||||
|
||||
---
|
||||
|
||||
|
||||
[Education 👨🏫 | Data 🔢](https://www.reddit.com/r/Superstonk/search?q=flair_name%3A%22Education%20%F0%9F%91%A8%E2%80%8D%F0%9F%8F%AB%20%7C%20Data%20%F0%9F%94%A2%22&restrict_sr=1)
|
||||
|
||||
Happy Wednesday Everyone!
|
||||
|
||||
I don't know about you, but today's drop to $177 and subsequent rebound has me jacked more than ever! Why, you may ask? Read on...
|
||||
|
||||
Preface
|
||||
|
||||
Some of you may have seen my post last week referencing Rocky Outcrop's custom Directional Movement Index (DMI) indicator and how it was showing we are due for a HUGE uptick in volatility after these past four weeks of sideways trading. If you haven't seen it yet, check it out here for more background:
|
||||
|
||||
<https://www.reddit.com/r/Superstonk/comments/obteg7/gme_the_powder_keg_ready_to_explode/>
|
||||
|
||||
Guess what? The DMI indicator switched off today which means we are officially ramping up in volatility for the near future. *This has lined up perfectly with numerous other TA indicators that show we may have officially hit our bottom at $177 and are turning around on higher volume*
|
||||
|
||||
If you don't like TA or think it is invalid, I respect that. Despite GME's heavy manipulation it has worked well for me and others to show the most likely outcome as to where prices may be heading.
|
||||
|
||||
My previous TA conducted on June 28 was based on what I saw at the time. The indicators were there, but none were screaming out at me. This time EVERYTHING is screaming at me. Now is the time.
|
||||
|
||||
We all want the same thing. BRRRRRRRR
|
||||
|
||||
*As usual, I am not a financial advisor and this is not financial advice!*
|
||||
|
||||
I'll try to keep this short. Here we go!
|
||||
|
||||
TLDR;
|
||||
|
||||
- DMI indicator is showing we are now entering a period of high volatility. This means larger price swings up and down for the next few weeks. *Say goodbye to trading sideways!*
|
||||
|
||||
- RSI is showing we hit Oversold levels today at $177
|
||||
|
||||
- The most common Fib Retracement level (0.618) from the March Low and June High prices was hit today at $177 ([/u/possibly6](https://www.reddit.com/u/possibly6/) - this might interest you)
|
||||
|
||||
- We bounced off of the 200 Period Moving Average (4 Hour Chart) today at, you guessed it, $177
|
||||
|
||||
- We bounced off of our current channel's support at, yes, $177
|
||||
|
||||
Multiple signs are all pointing to the same thing: $177 was indeed the bottom of this long drawn-out descending channel we've been in since June 10th. *Time will tell if this is holds to be true, but everything is screaming the same message. Onwards and upwards*
|
||||
|
||||
DMI
|
||||
|
||||
Check my previous post for more background on Rocky Outcrop's DMI and how it is an incredible indicator that shows explosions in volatility before they actually occur.
|
||||
|
||||
The indicator started flashing on June 29th and flashed off today July 7th.
|
||||
|
||||
[](https://preview.redd.it/vohwycfxmu971.png?width=803&format=png&auto=webp&s=3732a22cf8334961bea232d1b10d5e8e3948d185)
|
||||
|
||||
- After a DMI signal flashes on and off, the positive price action (DI+, yellow line above) and negative price action (DI-, pink line above) fight it out to become the dominant momentum. *Positive or negative momentum is confirmed after DI+ or DI- rise above the value of 38*
|
||||
|
||||
- Currently DI- is winning the fight which is normally a bearish sign; however, notice today's DI- rejection it had at 38 on the dot. This is indicated by the blue hashed line at the end of my arrows. This same scenario happened back in May before our huge run-up where DI- was rejected at 38, DI+ took over, and we blew up to $350
|
||||
|
||||
- If DI- manages to stay below 38 and DI+ picks up momentum, this would indicate another huge run-up with volatility in the very near future
|
||||
|
||||
- We will need a few more days to see how the DI+ and DI- action plays out. In any case, get ready for increased volume and volatility!
|
||||
|
||||
*Huh... the DI- began reverting right around the time the price hit $177. Must be a coincidence right...?*
|
||||
|
||||
RSI
|
||||
|
||||
The Relative Strength Index (RSI) is an indicator showing when prices may be overbought, oversold, or neutral.
|
||||
|
||||
[](https://preview.redd.it/2eybhogwsu971.png?width=1060&format=png&auto=webp&s=ad797d21dcadccea12e68540d5fce7afc2530a82)
|
||||
|
||||
- RSI officially entered oversold territory during today's price drop to $177 before it bounced back to the oversold boundary. This is indicated by the red hashed line above
|
||||
|
||||
- Previously the RSI hit this zone in March, April, and May where we then saw large price reversals afterwards
|
||||
|
||||
*Strange... the RSI hit the Oversold zone right around when the price hit $177. Must be another coincidence.*
|
||||
|
||||
Fib Retracement
|
||||
|
||||
Fib retracements are based on the famous Fibonacci Sequence which can be found all throughout nature. This is present even here in the stock market! Human buying/selling behavior tends to revolve around key Fibonacci levels. It works, and it works very well.
|
||||
|
||||
[](https://preview.redd.it/b6evhk49gw971.png?width=1283&format=png&auto=webp&s=f268ba97103ead1cc09a5b89b440fd9440f7420a)
|
||||
|
||||
Once a retracement begins and a top has been confirmed, we can draw a Fib Retracement from the previous extreme low to the extreme high. This will give us Fib Retracement Levels. If prices fall below the 0.236 level, they tend to continue dropping to the 0.618 level *in most cases**.*
|
||||
|
||||
- Previous Extreme Low: $117 (March 25th)
|
||||
|
||||
- Previous Extreme High: $343 (June 8th)
|
||||
|
||||
- 0.236 Level: $267. Notice we fell through this pretty hard on June 10
|
||||
|
||||
- 0.618 Level: $176/$177. Notice we hit this level today almost EXACTLY and bounced violently back to the upside.
|
||||
|
||||
- This would seem to indicate that the current downwards retracement could officially be complete
|
||||
|
||||
- There is a small possibility that we continue dropping down to the 0.786 Fib Level of $147 before we begin our retracement upwards; however, given all other factors outlined in this post I see this as highly unlikely at this time
|
||||
|
||||
*Weird... $176/$177 happens to also be the 0.618 Fib level from our previous High and Low? These coincidences just keep piling up...*
|
||||
|
||||
200 Period Moving Average
|
||||
|
||||
The 200 Period Moving Average has been very well respected on the 4 Hour GME chart. Any time GME touches or comes anywhere close to this line, it has had huge run-ups.
|
||||
|
||||
[](https://preview.redd.it/stmdkjxs0v971.png?width=1201&format=png&auto=webp&s=4b08c721a67ad0e477da6849b38287c827d2d712)
|
||||
|
||||
*Wow how odd?!? The 200 Period Moving Average today was at.... yes, you guessed it: $177*
|
||||
|
||||
Channel Support
|
||||
|
||||
Since June 11th we have been trading in a descending channel with upper resistance and lower support levels (see the white lines below)
|
||||
|
||||
[](https://preview.redd.it/gdpc0wqz7v971.png?width=1129&format=png&auto=webp&s=6aec79d2bcc258b6e51bf4dfd5feab9ff9d2d703)
|
||||
|
||||
GME has tested these levels multiple times over the past month as you can see on both the upper and lower end.
|
||||
|
||||
*Guess where the channel's lower support level is for today? Yep, $177*
|
||||
|
||||
Conclusion
|
||||
|
||||
- Today's drop to $177 when measured on numerous different indicators is showing signs of a big reversal
|
||||
|
||||
- If this reversal turns out to be true, it should be enough to carry us out of the current channel and then back upwards to the upper $200's before continuing onwards
|
||||
|
||||
- Volume and volatility are beginning to pick back up. This is what we need for another move to the upside
|
||||
|
||||
- *Reminder: I am not a financial advisor and this is not financial advice! :-)*
|
||||
113
Technical-Analysis/2021-07-07-The-Upward-Trend-Line.md
Normal file
113
Technical-Analysis/2021-07-07-The-Upward-Trend-Line.md
Normal file
@ -0,0 +1,113 @@
|
||||
Presenting : The Upward Trend Line and how visible patterns in GME price could explain short hedge funds strategy
|
||||
=================================================================================================================
|
||||
|
||||
| Author | Source |
|
||||
| :-------------: |:-------------:|
|
||||
| [u/Kalaeman](https://www.reddit.com/user/Kalaeman/) | [Reddit](https://www.reddit.com/r/Superstonk/comments/oez0cl/presenting_the_upward_trend_line_and_how_visible/) |
|
||||
|
||||
---
|
||||
|
||||
[Possible DD 👨🔬](https://www.reddit.com/r/Superstonk/search?q=flair_name%3A%22Possible%20DD%20%F0%9F%91%A8%E2%80%8D%F0%9F%94%AC%22&restrict_sr=1)
|
||||
|
||||
Disclaimer : I only started to get into trading last February and my portfolio is 100% GME. I learnt a lot over the past few months on this sub but still don't know much about trading in general so take everything I say with a grain of salt. However, I noticed clear patterns in GME price that are too visible to be coincidences in my opinion, and that I haven't seen talked much on this sub. I will offer my theories explaining the patterns but I hope more wrinkled brain apes can look into it and correct me if needed.
|
||||
|
||||
TL;DR : If the Second wedge started in June behave similarly than the previous wedge (and it looks like it is so far), we could see a good set up for the MOASS at the end of August. And also any other day before.
|
||||
|
||||
1 - The upward trend line
|
||||
|
||||
This is a line I drew quite some time ago. I actually [shared it on the sub](https://www.reddit.com/r/Superstonk/comments/n4vfx1/not_financial_advice_but_buying_the_dip_close_to/) last May after the price got close to the line again. The post didn't get much traction so let me give more details about why I think this line is meaningful. Here it is :
|
||||
|
||||
[](https://preview.redd.it/2f12tue5ig971.png?width=1285&format=png&auto=webp&s=b58ab508b68f761a957c37218471a6c2c4763d4f)
|
||||
|
||||
GME Trend line
|
||||
|
||||
To draw it you have to set two data points that correspond to the lowest price on 26th of February -86$ and 13th of April -132$. These round numbers give a total rise of 46$ in 31 business days with an average uptrend of 1,484$/day.
|
||||
|
||||
At first sight, we can quickly notice that even though there are huge swings, the price gets very close to this line a remarkably high amount of times. Between March and June I can count 7 times or period of time where it got really close to it.
|
||||
|
||||
But something that particularly caught my eye was how ridiculously close the price got from the trend line before the January run up :
|
||||
|
||||
[](https://preview.redd.it/0j8kidevng971.png?width=621&format=png&auto=webp&s=a51b01ba4769efcff06e875a9cf4a8dc7a316d7e)
|
||||
|
||||
Zooming to 14th December - 21st of January just before the first run up
|
||||
|
||||
23rd December and 14th January highest price of the day are literally touching the line perfectly (about 0.5% error) and we get 6 days total where it got pretty close. How crazy of a coincidence can it be that the price follows so accurately this trend line ? Especially since we are *before* the first run up even though the trend line was built using data *after* this first run up.
|
||||
|
||||
Let's now go back to a more recent action price :
|
||||
|
||||
[](https://preview.redd.it/6dauaymhvg971.png?width=811&format=png&auto=webp&s=270ff45b2cabc33073e47e42cd02a3441278cdd5)
|
||||
|
||||
10th June - 2nd July period
|
||||
|
||||
Even though it is not as obvious, to me the 25th, 28th, 29th and 30th are clearly trying to follow the trend line. Especially considering that the price shot up to 345$ during the June run up. My tits got unreasonably jacked during the last hour of 25th of June with 2M volume and the closing price ended up being precisely back on track with the trend line.
|
||||
|
||||
Starting December 14th, the price got significantly under the trend line only 4 times in total :
|
||||
|
||||
| Date | Duration (trading day) | max difference ($) | max difference (%) |
|
||||
| --- | --- | --- | --- |
|
||||
| 24th Dec - 12th Jan | 12 days | 23$ | 50% |
|
||||
| 8th Feb - 23rd Feb | 11 days | 40$ | 50% |
|
||||
| 10th May - 12th May | 3 days | 25$ | 15% |
|
||||
| 1st Jul - Present | 3 days so far | 21$ | 11% |
|
||||
|
||||
Those are only 4 data points but it appears that at least so far not only the duration when the price stays under the trend line gets smaller, but how far away from the trend the price can go gets smaller and smaller as well. It will be interesting to see if the price gets back to the trend soon or not.
|
||||
|
||||
2 - The March-April-May wedge
|
||||
|
||||
I kept on drawing lines and found out something quite interesting : If you draw a line between the highest peak in January and highest peak in March you get this :
|
||||
|
||||
[](https://preview.redd.it/tst8bcrlal971.png?width=987&format=png&auto=webp&s=64e6bb4067a6f5365e15e085f167fd47e154cdc0)
|
||||
|
||||
Descending trend line in yellow
|
||||
|
||||
As you can see it forms an almost perfect closing wedge at the beginning of May. There is a bit of resistance when it is crossing our upward trend line, then it is forcing its way down before getting back to the upward trend line only 3 days later.
|
||||
|
||||
And then something else appeared : it felt like the whole wedge is trending down at the same speed as the closing wedge. Most notably the 17th-23rd March, 14th-16th April and 19th-23rd April. I draw multiple lines parallel to our descending trend line to illustrate this :
|
||||
|
||||
[](https://preview.redd.it/y86wnb1odl971.png?width=987&format=png&auto=webp&s=a028a4a6574340cc124f252336ada853798d9fef)
|
||||
|
||||
Parallel trending lines
|
||||
|
||||
3 - The June wedge
|
||||
|
||||
I then applied the same logic to our more recent run up. I drew a line from the highest peak in January to the highest one in June and came up with this :
|
||||
|
||||
[](https://preview.redd.it/qvqsq0eigl971.png?width=1478&format=png&auto=webp&s=54548477322e8fd05bfed7add524aa9fc5deff83)
|
||||
|
||||
June descending trend line
|
||||
|
||||
You probably guess what I'm gonna do now... Draw parallel lines ! And what a surprise ...
|
||||
|
||||
[](https://preview.redd.it/4glohk94hl971.png?width=1478&format=png&auto=webp&s=485ee7a68e5fce58a96cebe1692c86cbe25aeba3)
|
||||
|
||||
June parallel trending lines
|
||||
|
||||
We are currently trading in a descending channel exactly parallel to the January to June highest points, just like what was happening during the previous wedge.
|
||||
|
||||
What means ??
|
||||
|
||||
So here is what I think : Citadel/Short hedge funds have a huge control over the price, but they have to stay within certain limits to stay solvent. Those limits are showing as linear trending lines on the graph. Please correct me if I'm wrong but I believe the reason it is linear is because Citadel primarily uses options which are derivatives of the market. By buying/selling options and hedging at specific times they control the speed at which the stock goes up or down. This means that they are able to transform retail instant buying pressure into a slow linear trend line. That is also why holding is an effective counter to their techniques.
|
||||
|
||||
As long as GME went down after March run up following this downside trend, they were good on their sheets. But when they realized they couldn't keep out of the upward trending line (too many diamond hands), they changed their strategy and went for another pump and dump. Someone suggested they sold crypto to avoid margin call. It could be that they sold crypto to buy GME for this new pump and dump, since the crypto drop happened exactly between the two wedges.
|
||||
|
||||
Big speculation here but I also think that Gamestop sold their shares to counter their pump and dump strategy. Big price movements are not happening because of retail and the price dropped instantly after the news got released that they were going to sell shares. My guess is that Citadel&Co realised they were going to lose a lot of money if they don't sell their shares now so they had to cancel the pump early. That's why Ryan knew it was going to go down instantly and told us to buckle up.
|
||||
|
||||
What this also tells us is that there is no improvements for short hedge funds between the first and second wedge. The price action is still based on the huge amount of options and new shorts created during the January squeeze. The only difference is the 200K puts that expired 16th of April. I think Hedge funds are getting low on ammo. Again.
|
||||
|
||||
What to expect next ?
|
||||
|
||||
I have added the t+21 cycles and some events coming on the chart and oh boy it looks juicy.
|
||||
|
||||
[](https://preview.redd.it/40r39mdz1m971.png?width=1392&format=png&auto=webp&s=056668839994edb58a5e39026a31a6b88fc29339)
|
||||
|
||||
T+21 cycles are the periodic vertical blue lines. NFT announcement 14th July.
|
||||
|
||||
I know I know, no dates but come on, here we can see on the graph at around the 20th of August, not only a T+21/T+35 (with 400K puts expiring !) event but also the closing of the big January-June Wedge. Of course short hedge funds could give up any time before that date, but stars seem to be aligning around this time.
|
||||
|
||||
They can push to get out of the linear trend line but I believe they cannot do it for long. Right now it seems that's what is happening. If the theory is correct, the price will eventually get back to the trend line, like it did many times before. We will see how long they manage to keep the price down but I wouldn't be surprised if right now is the lowest price GME will ever be at again. I hope so since I bought a few more shares again today !
|
||||
|
||||
On the other hand, right now could be what hedge funds think is their last chance to make people sell, so they could go all in to try to keep it low for a longer time like they did in February.
|
||||
|
||||
Keep in mind this is just a theory, it could be wrong or they could work very hard to make the theory become wrong. In any case I have complete trust there are only diamond hands here and MOASS is inevitable, however long it takes.
|
||||
|
||||
If people want to play with the chart you can make a copy [here](https://www.tradingview.com/chart/4MuabdvY/).
|
||||
@ -0,0 +1,90 @@
|
||||
Wen Moon ? [TA/DD/Elliot Wave/Gamma Squeeze(Options)]
|
||||
=====================================================
|
||||
|
||||
| Author | Source |
|
||||
| :-------------: |:-------------:|
|
||||
| [u/MOSfriedeggs](https://www.reddit.com/user/MOSfriedeggs/) | [Reddit](https://www.reddit.com/r/Superstonk/comments/n2witz/wen_moon_taddelliot_wavegamma_squeezeoptions/) |
|
||||
|
||||
---
|
||||
|
||||
[DD 👨🔬](https://www.reddit.com/r/Superstonk/search?q=flair_name%3A%22DD%20%F0%9F%91%A8%E2%80%8D%F0%9F%94%AC%22&restrict_sr=1)
|
||||
|
||||
Hello follow apes 🦍 this DD/TA post is a combination of my own smooth brain chart TA and the analysis of a professional trader and Youtuber named Andrew a.k.a Trading Sciences *(link at the end of the post)* Elliot Wave Theory/Options Chain Analysis.
|
||||
|
||||
This is going to be short and straight to the point as I want a maximum of Apes to understand what\
|
||||
might happen next week with our favorite stock. Please keep in mind these dates and prices are not set in stone, but will give you a general idea of where we could be going and what might end up happening this month. 🚀
|
||||
|
||||
Part I : MOAW (Mother Of All Wedges)
|
||||
|
||||
What Is a Wedge? ([source](https://www.investopedia.com/terms/w/wedge.asp))
|
||||
|
||||
*A wedge is a price pattern marked by converging trend lines on a price chart. The lines show that the highs and the lows are either rising or falling and differing rates, giving the appearance of a wedge as the lines approach a convergence. Wedge shaped trend lines are considered useful indicators of a potential reversal in price action.*
|
||||
|
||||
In this picture the *Yellow lines* represent our *MOAW***,** the green line represents the approximative price where *Elliot's Waves* converge it's also a great resistance/support. The blue line was made using our lowest and highest point from January 27th to try and illustrate how explosive the stock can be in the right circumstances in this case I was estimating a price of around 600$, triggering a massive gamma squeeze in the process and putting insane pressure on the short sellers.
|
||||
|
||||
I've try to draw this wedge using different prices and the result all pointed in the same direction, as you can see we we will be breaking out the giant Doritos somewhere around the end of next week.
|
||||
|
||||
[Doritos and crayons](https://preview.redd.it/zx322414hlw61.png?width=805&format=png&auto=webp&s=3773edd19aeecc37a25cc00cc792552d8aa634bd)
|
||||
|
||||

|
||||
|
||||
|
||||
Part II : MacDaddy
|
||||
|
||||
Moving average convergence divergence (MACD) is a trend-following momentum indicator that shows the relationship between two moving averages of a security's price. ([source](https://www.investopedia.com/terms/m/macd.asp))
|
||||
|
||||
As some of you might have noticed the MACD on the daily timeframe has been green for 3 trading days now, if we look at our last two run-up it took 7-8 trading days from the time the MACD turned green to the time it peaked, if history repeat hitself we would hit another peak somewhere around thursday/friday right on schedual to break out the Doritos.
|
||||
|
||||
[MACD](https://preview.redd.it/btwqsz07hlw61.png?width=539&format=png&auto=webp&s=afa64fd31dbc5a33fa3188d749c95a4a9b6dd583)
|
||||
|
||||

|
||||
|
||||
[3 days after MACD crossover](https://preview.redd.it/945rp457klw61.png?width=430&format=png&auto=webp&s=950cb872e243ba97dca84c39c9dd80b700a6ad53)
|
||||
|
||||

|
||||
|
||||
[wen moon?](https://preview.redd.it/dk7uajibklw61.png?width=440&format=png&auto=webp&s=0d1a61f75d6a71ba9db85b083bdd3277364b3ba9)
|
||||
|
||||

|
||||
|
||||
|
||||
PART III : Elliot Wave Theory
|
||||
|
||||
In his [*video*](https://youtu.be/GDeMralCaiY?t=130) Andew predict the price action, he explain in detail that according to Elliot Wave theory we would hit a stock price of approx. 216$ish erly next week *(Green line in the first picture/ Green circle in the picture underneath)*\
|
||||
following a possible correction, where apes would buy the dip en masse as usual. From there, it's impossible to predict the exact price but according to his analysis it would be around 800$+**. (Keep that in mind for the next part)**
|
||||
|
||||
[Elliot Wave](https://preview.redd.it/du60t9adklw61.png?width=806&format=png&auto=webp&s=340a1ccbf40b3d22b215ea1df749723e5fe348ee)
|
||||
|
||||

|
||||
|
||||
Part IV : Gamma Squeeze
|
||||
|
||||
A "gamma squeeze" is a trading terminology that refers to massive call buying leading to higher stock prices, which leads to more call buying, a higher stock price and so on.
|
||||
|
||||
For a gamma squeeze to start, a group of small retail traders or one big trader betting that a stock will rise buy short-dated call options in the underlying stock.
|
||||
|
||||
Once they buy these call options, the investment banks and intuitional investors that sell them essentially become short the underlying stock.
|
||||
|
||||
Should the traders buy more call options, market makers and institutional brokers will be forced to buy more shares of the underlying stock to hedge their short position.
|
||||
|
||||
Just like a short squeeze, as the price of a stock begins to go up and traders increase their call positions, market makers are forced to buy the underlying the stock thus pushing its price higher.
|
||||
|
||||
Investors selling or writing the call are hoping the price will fall, but like going short, the downside can technically be limitless because the stock can keep on climbing instead of dropping to zero.
|
||||
|
||||
If a stock has low liquidity, the latter can cause the share price to rise even further, forcing brokerages to purchase even more shares as the value of their exposure increases further as the share price gets closer to the strike price of call options.
|
||||
|
||||
Wheter its 200$/300$/400$/600$/800$ doesn't matter, Hedgies are fucked. By looking at the picture below I hope you understand why they fought so hard to keep the price below 180$ this week. if you want more in depth explanations on this, watch the video I [linked](https://youtu.be/GDeMralCaiY?t=461) below at the 7:41 mark where he compares GME to other stocks and tell us why this is very bullish.\
|
||||
Someone can correct me if I'm wrong, but in theory if we go above 200$ it could create a domino effect of FOMO/*gamma squeeze* that will then trigger a *MOASS* completly annihilating short sellers in the process.
|
||||
|
||||
[Options go STONK!!!](https://preview.redd.it/6skqhhleklw61.png?width=672&format=png&auto=webp&s=e15133270aecbbe6907f096da66635064ecf0575)
|
||||
|
||||
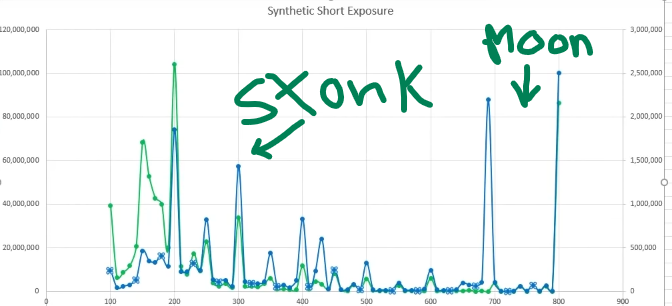
|
||||
|
||||
*TLDR :*\
|
||||
Buy and HOLD. MACD, giant Wedge, Elliot Wave Theory and Options are extremly bullish for next week. I Know TA is not 100% reliable on GME, this is only my personal opinion and not financial advice.
|
||||
|
||||
*Trading Sciences video on EWT/Options :*\
|
||||
<https://www.youtube.com/watch?v=GDeMralCaiY>
|
||||
|
||||
Only reason this will work is because I know most APES by now have hands as hard as [💎](https://emojipedia.org/gem-stone/) and would never sell at a low price. Remember the upside is limitless 🚀\
|
||||
I apologize in advance for mistakes as english isn't my first language.
|
||||
@ -0,0 +1,56 @@
|
||||
wen moon ? II : wen in doubt ¦
|
||||
==============================
|
||||
|
||||
| Author | Source |
|
||||
| :-------------: |:-------------:|
|
||||
| [u/MOSfriedeggs](https://www.reddit.com/user/MOSfriedeggs/) | [Reddit](https://www.reddit.com/r/Superstonk/comments/n4b6kf/wen_moon_ii_wen_in_doubt/) |
|
||||
|
||||
---
|
||||
|
||||
[DD 👨🔬](https://www.reddit.com/r/Superstonk/search?q=flair_name%3A%22DD%20%F0%9F%91%A8%E2%80%8D%F0%9F%94%AC%22&restrict_sr=1)
|
||||
|
||||
Greetings 🦍 I wanted to do a quick follow up on my last [*DD*](https://www.reddit.com/r/Superstonk/comments/n2witz/wen_moon_taddelliot_wavegamma_squeezeoptions/) and give my opinion on what happened today and how it relates to my previous post. Also wanted to say thanks to everybody who took the time to read it, special shout out to those who gave awards. I will release part 3 next week-end to recap the week and give a review on how everything turned out. Once again this is gonna be straight to the point.
|
||||
|
||||
You can check out Part 1 [*here*](https://www.reddit.com/r/Superstonk/comments/n2witz/wen_moon_taddelliot_wavegamma_squeezeoptions/)
|
||||
|
||||
Part 1 : GUH ?
|
||||
|
||||
This morning large funds and their agents tried to short us into oblivion in an attempt to slow down our bullish momentum (What's behind 180 Kenny ?), we were breaking out the wedge ahead of schedual and they just couldn't let it happen. **(***See for yourself in the picture below)*. You can also see that their first attempt on may 30th wasn't succesful so they knew they had to go hard this time. In the next part, I will explain why I believe it doesn't matter as much as you'd think and why I believe it's desperation.
|
||||
|
||||
[](https://preview.redd.it/uu4duv2ukzw61.png?width=505&format=png&auto=webp&s=74c39eabed03c109963729621ae4c6b0b1bd1bb9)
|
||||
|
||||
GUH?! really Kenny ?
|
||||
|
||||
Part 1 : The Unbreakable Trend Line
|
||||
|
||||
Ever since February Hedgies haven't been able to break the trendline represented by the **THICC dotted yellow line. (**also the bottom part of the wedge) Meaning, that agaisnt all odds we've been on a slow and steady climb. I believe this is due to the fact that we've doing such a great job at buying + holding 🚀 , (*as you can see from the pictures below)* , it's been a constant battle but we refused to gave them an inch.
|
||||
|
||||
The fight started to turn in our favor so they bombarded the shit out us this morning. this THICC line should be our launching pad, shorts want this to be the the edge of the world and make us crash down.
|
||||
|
||||
As you can see, even after today brutal attack we're still on course to break out. HOLDING STRONG as always. We don't like dates so much around here, but this week and cinqo de buyo *(shoutout to whoever came up with that name)* will be decisive *IMO* . *When in doubt Just zoom out bro*
|
||||
|
||||
😎
|
||||
|
||||
[](https://preview.redd.it/ic54j2x4jzw61.png?width=693&format=png&auto=webp&s=4b50a3a567a07a63e50765c5957a1edc826d412a)
|
||||
|
||||
Daily time frame
|
||||
|
||||
[](https://preview.redd.it/g9l6g3f7jzw61.png?width=697&format=png&auto=webp&s=6f2296cd2039beac03429d2e432aaca99e6cbe00)
|
||||
|
||||
4H time frame
|
||||
|
||||
[](https://preview.redd.it/aeeunf0jnzw61.png?width=777&format=png&auto=webp&s=8c58b59ee6679265160d51f016bb5c0c40a1573d)
|
||||
|
||||
1 Min
|
||||
|
||||
Part 3 : What's next ??? Wen moon ???
|
||||
|
||||
If we continue to trade above the THICC YELLOW LINE like we've been doing ever since February we will eventually see 200$ again 🐢, like I said in my previous *DD* Hedgies don't want that for obvious reasons.
|
||||
|
||||
I would expect the more of the same tommorow. Huge sell-off at open with us playing catch up all day trying to keep our head above water. Their goal will be to sink us below *154$, doing that would break the trendline for the first time and make us deviate from our momentum.* Expect fuckery and as always. BUY+HOLD 🙌 💎
|
||||
|
||||
If we manage to stay on course and break out the trendline on the 5th/6th with some decent volume, the stock could get really explosive like we all know it can.
|
||||
|
||||
*As always feel free to comment if you disagree, or if you want to say thanks it is much appreciated.*
|
||||
|
||||
This is only my personal opinion and not financial advice.
|
||||
@ -0,0 +1,58 @@
|
||||
wen moon ? III : Destroyer Of All FUD [TA/MOAW/Options/Elliot Wave/Gamma Squeeze/MOASS]
|
||||
=======================================================================================
|
||||
|
||||
| Author | Source |
|
||||
| :-------------: |:-------------:|
|
||||
| [u/MOSfriedeggs](https://www.reddit.com/user/MOSfriedeggs/) | [Reddit](https://www.reddit.com/r/Superstonk/comments/n7zf0l/wen_moon_iii_destroyer_of_all_fud/) |
|
||||
|
||||
---
|
||||
|
||||
[DD 👨🔬](https://www.reddit.com/r/Superstonk/search?q=flair_name%3A%22DD%20%F0%9F%91%A8%E2%80%8D%F0%9F%94%AC%22&restrict_sr=1)
|
||||
|
||||
Greetings once again [🦍](https://emojipedia.org/gorilla/) as promised, this post will be a follow up on my two previous DD if you want to read them or challenge me on my predictions both links are below.
|
||||
|
||||
[I](https://www.reddit.com/r/Superstonk/comments/n2witz/wen_moon_taddelliot_wavegamma_squeezeoptions/) wen moon ?[II](https://www.reddit.com/r/Superstonk/comments/n4b6kf/wen_moon_ii_wen_in_doubt/). wen moon ? II : wen in doubt
|
||||
|
||||
Alot of Good DDs came out recently so I wanted to join in on the action and offer my own perspective I also wanted to follow up the prediction that were made last week. In combination I will back my observations using Wardenlive endgame [DD](https://www.reddit.com/r/Superstonk/comments/n5me5g/the_mother_of_all_wedges_an_endgame_dd_technical/) and Trading Sciences TA [latest video](https://www.youtube.com/watch?v=riDSUjSdixA). Once again I'll keep everything short and straight to the point.
|
||||
|
||||
PART 1 : MOAW revisited (MOTHER OF ALL WEDGES)
|
||||
|
||||
*If you haven't read Warden* [*DD*](https://www.reddit.com/r/Superstonk/comments/n5me5g/the_mother_of_all_wedges_an_endgame_dd_technical/) *on the MOAW i highly recommend it, my first* [*DD*](https://www.reddit.com/r/Superstonk/comments/n2witz/wen_moon_taddelliot_wavegamma_squeezeoptions/) *that came out a week prior also explains in sort of a* *TLDR* *version.*
|
||||
|
||||
As you can see on the images below we broke out the APEX of the wedge on the upside, finishing green on friday at 161.11$, this to me is extremly bullish. In my second [DD](https://www.reddit.com/r/Superstonk/comments/n4b6kf/wen_moon_ii_wen_in_doubt/) I predicted that last week Hedgies would try to bring us below that RED line to try and break our *bullish* momentum and ho boy! did they try. On monday and tuesday they attacked us viciously bringing in us down from 177 to 151.86.
|
||||
|
||||
Once again our diamonds hands prevailed.
|
||||
|
||||
[$GME broke out the MOAW on the upside (daily timeframe)](https://preview.redd.it/o8rqos64hyx61.png?width=624&format=png&auto=webp&s=645e405d9ebfa77d9231580dafab84eaff7cb893)
|
||||
|
||||
[$GME breakout of the MOAW (4h timeframe)](https://preview.redd.it/auqeq6s0jyx61.png?width=564&format=png&auto=webp&s=59d5ad02c653acf7a13068477ebba7a0f7c4c13a)
|
||||
|
||||
[Massive attacks Monday and Tuesday](https://preview.redd.it/oo5wbps9kyx61.png?width=382&format=png&auto=webp&s=3184c336d9fedfd61a646e2c3263e5614c16a30d)
|
||||
|
||||
PART II : The Unbreakable Trendline
|
||||
|
||||
In my second [DD](https://www.reddit.com/r/Superstonk/comments/n4b6kf/wen_moon_ii_wen_in_doubt/), I theorized that as long as this trendline would hold we would be in good shape, I've also pointed out that Hedgies would attack it hard, as they did earlier last week. I was happy to see that it held. If Shorts are not able to break it in the near future, we are gonna see 200 soon-ish meaning we are indeed inevitable mid-long term, find out why in part 3-4.
|
||||
|
||||
<https://preview.redd.it/i7drpjvflyx61.png?width=440&format=png&auto=webp&s=1c071a502cf6dbd34827c8f885dad5f16968c12c>
|
||||
|
||||
[Possible outcome over the next month](https://preview.redd.it/y9iq7yuelyx61.png?width=538&format=png&auto=webp&s=46ec06b20c10193acac8c01300d1c7970bf79c16)
|
||||
|
||||
[from WardenLine ENDGAME MOAW DD.](https://preview.redd.it/fawsvphtmyx61.png?width=1225&format=png&auto=webp&s=f31b3404b97d864751148a0898e6e18e3b9a69c1)
|
||||
|
||||
To ruin this trend they would need to sink Gamestop below 150-140 and decrease it's price daily over a month, but I don't see APES letting it happen because all we know is BUY+HODL 🚀.
|
||||
|
||||
[Kenny G wet dream](https://preview.redd.it/zs58s9thoyx61.png?width=380&format=png&auto=webp&s=dbeacc76fc214a130d7e508bbc1871089f66b651)
|
||||
|
||||
PART 3 : Elliot Wave Theory
|
||||
|
||||
In his latest upload titled [THE MOASS IS COMING](https://youtu.be/riDSUjSdixA?t=199) pro trader Trading Sciences explain why he thinks we are in complexe correction in regards to the Elliot Waves and gives possible scenarios as to where our beloved stock could land in the next few months, but he seems conviced that a price between 800$-2100$ is a possibility in the near future. This seems to in sync with my theory about our trendline, where over a few months the stonk will just slowly rise up despite hedge funds best effort to keep it down.
|
||||
|
||||
[800$+++ Target price](https://preview.redd.it/gd9el5d1ryx61.png?width=1218&format=png&auto=webp&s=8d952d148d7e3e93b68f5b4a48f4c140cce21f6c)
|
||||
|
||||
PART 4 : Options / Gamma Squeeze / MOASS
|
||||
|
||||
As far as Options goes nothing has really changed since my last post, things are still looking super bullish. Here's why; From 200$ up, Hedgies are massively exposed due to the ammount of synthetics shorts and the insane number of call options at the 200/300/400 and 800 strike price. As of right now Gamestop has a *40%* chance of trading above 800$ in july. Explanation in the [video](https://youtu.be/riDSUjSdixA?t=629) starts at 10:30.
|
||||
|
||||
<https://preview.redd.it/cab1v2i4vyx61.jpg?width=632&format=pjpg&auto=webp&s=cc219b5c647a9bf31875ab672c821bfb9eadce95>
|
||||
|
||||
TLDR : BUY + HOLD and vote !!!! , no but seriously all you have to do at this point and wait for the inevitable to happen I strongly believe that very soon Gamestop will break out. I will personally buy more in a few weeks and consolidate my xx @ 150. In regards to all the information in this DD, I believe we've been Bullish and on our way to the moon ever since DFV last tweet, he knew. Love you all and I hope you enjoy this post.
|
||||
@ -0,0 +1,132 @@
|
||||
wen moon IV : Twist of Fate (Psychological analysis/TA/Price Prediction)
|
||||
========================================================================
|
||||
|
||||
| Author | Source |
|
||||
| :-------------: |:-------------:|
|
||||
| [u/MOSfriedeggs](https://www.reddit.com/user/MOSfriedeggs/) | [Reddit](https://www.reddit.com/r/Superstonk/comments/njdu1z/wen_moon_iv_twist_of_fate_psychological/) |
|
||||
|
||||
---
|
||||
|
||||
[DD 👨🔬](https://www.reddit.com/r/Superstonk/search?q=flair_name%3A%22DD%20%F0%9F%91%A8%E2%80%8D%F0%9F%94%AC%22&restrict_sr=1)
|
||||
|
||||
Greetings 🦍, hope you all had a nice week-end. In this DD I will give you my opinion on the current FUD situation regarding our favorite stock, aswell as my price prediction and target based on my own due diligence and research. I've also included TA from [Tradespotting](https://www.youtube.com/channel/UCI24I7XHA2yY4Fs-pVmplpA) and [Trading Sciences](https://www.youtube.com/channel/UCuSZPMtuCptWvnC7fGCzzjw) who are in my opinion knowledgable traders with different opinions and methods. As always everything will be a simple as possible to understand and straight to the point.
|
||||
|
||||
Part 1 : It's impossible, GIVE UP !
|
||||
|
||||
[](https://preview.redd.it/wnm490pzmw071.png?width=640&format=png&auto=webp&s=edbd1e04fabd09f713939abbe3533131487dd605)
|
||||
|
||||
Naysayers : one who denies, refuses, opposes, or is skeptical or cynical about something, there are always naysayers who say it can't be done.
|
||||
|
||||
As of today the narrative toward us has not changed, as we grow in numbers and as our POSITIONS increase, so does the hate we receive. it's not that they care about your investment or your money. They would just fucking hate to see you succeed and come out on the side winning of a twist of fate.\
|
||||
🎲
|
||||
|
||||
They talk alot, and I mean alot of games for people who can't even put(S) their money where their mouth is. Pay no mind to these backseat paper handed investors, the plan has never changed and will never change. BUY + HODL. 🚀
|
||||
|
||||
For your sake don't listen to people who have no stake in the game, trust yourself and your intuition/DD. If you decide to buy/sell do it on your own accord, don't listen to me or anybody. If you need the capital don't starve yourself to death, hold what you can only .
|
||||
|
||||
*Let me put it this way, if you are extremly over leveraged or in a bad spot fiancialy, their propaganda will be that much effective. I'm currently holding XX because I can't afford more and that is perfectly fine with me.*
|
||||
|
||||
We need hype, we need STRONG APES. Personally I will NEVER EVER give up on my shares until the price is right and I will add slowly to my position every two weeks, and in due time we will we take everything they have stolen from us with their fraud, we will take the company and the jobs they tried to erase to the fucking MOON.
|
||||
|
||||
Slow and steady wins the race 🐢
|
||||
|
||||
*It was never be going an easy fight going up agaisnt these people but i'm proud of everyone single one of you.*
|
||||
|
||||
To conclude my introduction and transition into my next segment, I will leave you with this absolute slapper of a [speech](https://youtu.be/qW2hjhN3mZs?t=69) by Tradespotting ;
|
||||
|
||||
<https://youtu.be/qW2hjhN3mZs?t=69> (direct Youtube link)
|
||||
|
||||
Part 2 : Twist Of Fate (Historical Volatility TA by Tradespotting)
|
||||
|
||||
Historical volatility (HV) is a statistical measure of the [dispersion](https://www.investopedia.com/terms/d/dispersion.asp) of returns for a given security or [market index](https://www.investopedia.com/terms/m/marketindex.asp) over a given period of time. Generally, this measure is calculated by determining the average deviation from the [average price](https://www.investopedia.com/terms/a/averageprice.asp) of a financial instrument in the given time period. Using [standard deviation](https://www.investopedia.com/terms/s/standarddeviation.asp) is the most common, but not the only, way to calculate historical volatility. The higher the historical volatility value, the riskier the security. However, that is not necessarily a bad result as risk works both ways---bullish and bearish.
|
||||
|
||||
Source : <https://www.investopedia.com/terms/h/historicalvolatility.asp>
|
||||
|
||||
This signal went off last year around July , it's very rare that it goes off.
|
||||
|
||||
The last time it happened it took the price UP 100%.
|
||||
|
||||
[](https://preview.redd.it/fndcaitlow071.png?width=845&format=png&auto=webp&s=f3d41c325002cf149f7b31ed88c41202cfa3e5e6)
|
||||
|
||||
HV signal going off (summer 2020)
|
||||
|
||||
[](https://preview.redd.it/lx9rk0vtow071.png?width=458&format=png&auto=webp&s=fe7819278fa8fe63bab7561c11c458d919480bb6)
|
||||
|
||||
HV signal going off again (spring/summer 2021)
|
||||
|
||||
Shout-out to Tradespotting for his awesome speech and finding out about this indicator.
|
||||
|
||||
You can watch the first 13 minutes of this [video](https://youtu.be/4Y9dTCr98xY?t=60) for **in depth explanations.**
|
||||
|
||||
<https://youtu.be/4Y9dTCr98xY?t=655> (direct Youtube link)
|
||||
|
||||
*''One way or another a move is coming, and this move is gonna blow people socks off''*
|
||||
|
||||
Part 3 : MOAW : Mother Of All Wedges (revisited)
|
||||
|
||||
The first day we broke out of the MOAW GME plunged, in my opinion this was done on purpose to attack investor psychologically (HO NO ! It's breaking on the downside )
|
||||
|
||||
Nevertheless ever since that day we've been on a run, because guess what ? None of you beautiful APES bought their bluff . The MOAW ended up being a self fullfiling prophecy confirming our bullish momentum.
|
||||
|
||||
[](https://preview.redd.it/e7ts0eqjpw071.png?width=470&format=png&auto=webp&s=4037fdad82057c30431cd8b20c9bce508f2e4d5b)
|
||||
|
||||
GME breaking out the MOAW on the upside.
|
||||
|
||||
Part 4 : MACDaddy II
|
||||
|
||||
We just had the MACD turn green again. This alone is not a guarantee by any mean as a proof of that the last time it occured it ended up being a fake breakout.
|
||||
|
||||
Will it be different this time ? No way to tell for sure, but it's definetly something to keep an eye on and as long as GME remain above 173$ we are BULLISH.
|
||||
|
||||
Shorts don't want us past the 188$ level because historically they tend to lose control on the price action.
|
||||
|
||||
[](https://preview.redd.it/3ihxam40qw071.png?width=568&format=png&auto=webp&s=c518ad9c6eb92a3fb587931b694ec2134a717eca)
|
||||
|
||||
MACD turning gree again, hopefully this time we see a strong move.
|
||||
|
||||
[](https://preview.redd.it/ccji611hqw071.png?width=851&format=png&auto=webp&s=a69ff20b73a56c6252ee734ac7d42339f2d90f2d)
|
||||
|
||||
Will we break out above 188$ next week ?
|
||||
|
||||
Part 4 : Elliot Waves and Fibonnacies (TA by Trading Sciences)
|
||||
|
||||
What is Elliot Waves Theory ? <https://www.investopedia.com/terms/e/elliottwavetheory.asp>
|
||||
|
||||
What are Fibs (Fibonnaci retracement) ? <https://www.investopedia.com/terms/f/fibonacciretracement.asp>
|
||||
|
||||
I'm not the biggest fan of Elliot Waves but I think it's something worth talking about ,and also something we can look back on afterward to see how accurate it ended up being.
|
||||
|
||||
As far as fibs are concerned they highlight very strategic level (Historically) on GME that Hedgies tend to look at.
|
||||
|
||||
anything between the 0.38 and 0.5 (230$ - 280$) is what you could call the lava zone for them (MARGIN CALLS 📞)
|
||||
|
||||
[](https://preview.redd.it/b652z5eisw071.png?width=710&format=png&auto=webp&s=600240009b5b1b2d0d739c6af6dc2ce21981b22e)
|
||||
|
||||
Elliot Waves theory future prediction in relation to Fibs retreacement
|
||||
|
||||
[](https://preview.redd.it/y23gfpp4ww071.png?width=1220&format=png&auto=webp&s=62da1d1297fff1ae4eac02d88e794548771d9b39)
|
||||
|
||||
Elliot Wave in relationship with the HV indicator I mentioned earlier.
|
||||
|
||||
According to Elliot Waves we should be hitting 195$ next week then get rejected back to our current level only to make a HUGE move up to our previous high (500$+) around the mid July. Get rejected once more to the 200's to finally gap up 🚀 and start squeezing in September/November.
|
||||
|
||||
On the second picture you will see that the indicator shown in Part II (HV) seem to go hand in hand with Elliot Waves theory, this is why I like to use different sources and analyst to confirm my bias.
|
||||
|
||||
*Elliot Wave theory TA Trading Sciences explain why his medium term price target for GameStop is 800$+ and how we will reach it. **IN DEPTH***\
|
||||
<https://youtu.be/pue9tFpjRYk?t=95> (Direct Youtube link)
|
||||
|
||||
Final part: Price prediction, TLDR and conclusion
|
||||
|
||||
My price target for GME 2021 :
|
||||
|
||||
June : 188 - 220$
|
||||
|
||||
July : 220$ - 300$
|
||||
|
||||
August : 300 - 500$
|
||||
|
||||
September/November/December : 500$ - 800$++++ (Gamme Squeeze into Short Squeeze)
|
||||
|
||||
TLDR : BUY + HODL + vote. Do not invest more than you can afford to lose otherwise FUD becomes effective, look out for your brother and sister apes. This is my own opinion based on my own DD, not financial advice. Expect volatility and strong moves very soon on GME. If you chose to interact with shills do it in the mindset that they are not Nostradamus and can't predict the future more than you do, they just have a bearish 🐻 bias.
|
||||
|
||||
GME TO THE MOON 🚀
|
||||
@ -0,0 +1,96 @@
|
||||
Wen Moon 5 : Ascension (TA/Elliot Waves/Wyckoff/Price Prediction)
|
||||
=================================================================
|
||||
|
||||
| Author | Source |
|
||||
| :-------------: |:-------------:|
|
||||
| [u/MOSfriedeggs](https://www.reddit.com/user/MOSfriedeggs/) | [Reddit](https://www.reddit.com/r/Superstonk/comments/nns1um/wen_moon_5_ascension_taelliot_waveswyckoffprice/) |
|
||||
|
||||
---
|
||||
|
||||
[DD 👨🔬](https://www.reddit.com/r/Superstonk/search?q=flair_name%3A%22DD%20%F0%9F%91%A8%E2%80%8D%F0%9F%94%AC%22&restrict_sr=1)
|
||||
|
||||
Greetings once again 🦍 , what a week it has been, I hope your tits are as jacked as mine . Once again we achieved what they said couldn't be done, smashing expectations resulting in [Millions of $ lost by short sellers.](https://www.bloomberg.com/news/articles/2021-05-26/gamestop-and-amc-s-wednesday-rally-hand-shorts-673-million-loss) This long week-end is the perfect opportunity to regroup, re-focus and prepare ourselves for the what is coming. It's okay to be feel confident and be happy about our results but like the late great Kobe Bryant said *''Job's not done''.*
|
||||
|
||||
If you missed out on the action, we opened the week at *180$ bulldozing trought sell walls and closing at 222$ on friday after a brutal short attack.* A truly desperate move by short sellers and market makers to prevent the massive amount of 250$ Calls to finish ITM (In the money) . This would have been a disaster, if 🦍 didn't HOLD and had stop losses set up. Not only did we mitigate the crash but we landed in a perfect spot for next week buyers, finishing the week UP 40$ (+25,57%).
|
||||
|
||||
We also completed Wave 1 of Elliot, heading into Wave 2 next week.
|
||||
|
||||
[](https://preview.redd.it/iq6lbt5rr2271.png?width=800&format=png&auto=webp&s=7b0f8b8751feffa92f99b9c4c55d7062e1f76a61)
|
||||
|
||||
Friday short attack (organic price movement lol)
|
||||
|
||||
[](https://preview.redd.it/9i5ewz14u2271.png?width=873&format=png&auto=webp&s=700cd93cf4fdf07ecef6bf532f1bbd8b3b093cd6)
|
||||
|
||||
OOF ! What a week for GameStop! UP 40$ (+25,57%) with a high of 268$.
|
||||
|
||||
ASCENSION : Technical Analysis
|
||||
|
||||
*1\. Fibonnaci Retreacement + Elliot Waves*
|
||||
|
||||
We completed Wave 1 of Elliot with a high of 268.80$ (BULLISH), right now we are looking for Wave 2meaning we are looking for a a retreacement (low) between 218$ - 187$, once we find that low we will bounce back up, the higher is our low the crazier the bounce back will be. In my analysis I used the worst case scenario of 187$ish as I like to stay conservative with numbers. To give you a good perspective here's what the next move could look like. Using Fibonnaci Extension we can estimate what the next move is gonna be (it's actually insane) but see for yourself on the second picture.
|
||||
|
||||
[](https://preview.redd.it/4ue5w7w8y2271.png?width=767&format=png&auto=webp&s=db618e610b24ed1f6a20550ab59ac6f464d02789)
|
||||
|
||||
Wave 1 Completed, Wave 2 in completion and Wave 3 is 🚀
|
||||
|
||||
[](https://preview.redd.it/ouyc75g703271.png?width=850&format=png&auto=webp&s=5a9459856f558b9ca26650cc41d5770bf21d53f7)
|
||||
|
||||
Wave 3 is gonna blow people socks off ( 300 - 780$ )
|
||||
|
||||
2\. When to Buy The Dip (Swim with with Wales)
|
||||
|
||||
This part really concerns X,XX APES more than others because some of you might want to buy a few more times before we rocket and it get too expensive. Perfectly understandable, so I will give you the levels to buy. Keep in mind long 🐳 know these level and they will buy aswell. As small fishes we wanna swim alongside them and let them carry us to our destination. You don't want to miss these prices simply because you might never see them again. 🐳
|
||||
|
||||
You could set alarm at these prices and be ready to buy when it hits, keep in mind it could very well bounce monday at opening or friday at close, there's no way to know for sure when wave 2 will be completed, just keep these prices in mind. 187$ would be an insane snipe as I believe 180$ is the floor, 237ish$ is your LAST CHANCE. don't miss out !!!! 187$ - 203$ - 217$ - 237$.
|
||||
|
||||
[](https://preview.redd.it/rcl9fpfu33271.png?width=852&format=png&auto=webp&s=e968b7aaf9f3d98892740183c3535967668bb754)
|
||||
|
||||
187$ - 203$ - 217$ - 237$
|
||||
|
||||
3\. Long Ladder Attack (Stairway to heaven) / HV (180$ is the new Floor)
|
||||
|
||||
I know this term doesn't really exist but I just wanted to call it that way for lack of a better one, basically it's just a staircase to andromeda with every candle being bigger and gaining more momentum and volume due to short covering. It could start looking something like this from the monthly view. I think this is were we are heading, straight to the moon. Looking at it long term make it seem way more feasible and less crazy, just remember the upside is limitless. It's also in my believe that anything above 500$ is GAME OVER.
|
||||
|
||||
[](https://preview.redd.it/v37pepa573271.png?width=847&format=png&auto=webp&s=0b08e596c0cd2b78b01baff3f331a7fd2e31f254)
|
||||
|
||||
The staircase to Andromeda
|
||||
|
||||
Regarding (HV)
|
||||
|
||||
*Historical volatility (**HV**) is a statistical measure of the dispersion of returns for a given security or market index over a given period of time. Generally, this measure is calculated by determining the average deviation from the average price of a financial instrument in the given time period*.
|
||||
|
||||
This is very rare signal, and I touched on it my briefly in my [last DD](https://www.reddit.com/r/Superstonk/comments/njdu1z/wen_moon_iv_twist_of_fate_psychological/), it is in my understanding that once this signal is given before a period of volatility these prices are never seen again. It was given once in July 2020 before the initial run up in January and has been given again in previous weeks. Meaning we are probably looking at another huge gap up but this time RH won't be able to shut it down.
|
||||
|
||||
Shoot out to youtuber [Tradespotting](https://youtu.be/4Y9dTCr98xY?t=200) for figuring this one out.
|
||||
|
||||
[](https://preview.redd.it/r4778c17c3271.png?width=822&format=png&auto=webp&s=99c09e2bbd82e0c19035c1f93eba4973530e4f1a)
|
||||
|
||||
VOLATILITY INCOMING 180$ is our launching pad 🚀
|
||||
|
||||
if you want to read on Wyckoff and what could possibly be the last possible bearish thesis regarding GME follow this link. IMO this isn't a big deal but it's worth checking out regardless.
|
||||
|
||||
<https://school.stockcharts.com/doku.php?id=market_analysis:the_wyckoff_method>
|
||||
|
||||
Part 3 : TLDR + Price Prediction + Wen dip ?
|
||||
|
||||
BUY + HODL + VOTE 🚀 what else can be said ? You guys are amazing ! Hold on tight we are about to MOON 🌙 hedgies are fucked beyond comprehension. If you want to buy more do it quickly because these low prices won't be here much longer.Much love and a big shout out to this community
|
||||
|
||||
GG WP for this week
|
||||
|
||||
❤️
|
||||
|
||||
If you want to buy the dips these are the best prices I found using Fibonaccis;
|
||||
|
||||
Updated entry points for GME 2021 :
|
||||
|
||||
187$ (BEST) - 203$ - 217$ - 237$ (LAST CALL)
|
||||
|
||||
Updated price target for GME 2021 :
|
||||
|
||||
June : 188 - 260+ (strong resistance at 250)
|
||||
|
||||
July : 260 (strong resistance at 250) + - 300+
|
||||
|
||||
August : 300+ - 500$ (huge battle)
|
||||
|
||||
September : 500$ (huge battle) - ♾ $ (GG)
|
||||
@ -0,0 +1,105 @@
|
||||
wen moon 6 : The Return of the Cat (Recap/TA/Price Prediction/Entries)
|
||||
======================================================================
|
||||
|
||||
| Author | Source |
|
||||
| :-------------: |:-------------:|
|
||||
| [u/MOSfriedeggs](https://www.reddit.com/user/MOSfriedeggs/) | [Reddit](https://www.reddit.com/r/Superstonk/comments/nt8tir/wen_moon_6_the_return_of_the_cat_recaptaprice/) |
|
||||
|
||||
---
|
||||
|
||||
[DD 👨🔬](https://www.reddit.com/r/Superstonk/search?q=flair_name%3A%22DD%20%F0%9F%91%A8%E2%80%8D%F0%9F%94%AC%22&restrict_sr=1)
|
||||
|
||||
Greeting 🦍 ! What an awesome surprise we had with the return of DFV 🐱 his meme game is still on point and it feels great to know he's still with us. Amazing week overall for us in term of price action. As far as news nothing too crazy except the infamous [freudian slip](https://en.wikipedia.org/wiki/Freudian_slip) from Ms. Lee confirming what all apes around the world already knew. Sit back grab a drink and let me guide you through what's coming up next week for us. Again this doesn't take into account 6/9 or other possible future announcements as it's impossible to predict the effect they would have on people.
|
||||
|
||||
In the *TLDR* you will find my *TIERLIST* of entries for this week aswell as my price prediction for the future, those have remained mostly unchanged as I still feel like our pace is pretty much the same. 🚀
|
||||
|
||||
[](https://preview.redd.it/uzlpt3pmui371.png?width=328&format=png&auto=webp&s=41d8e16dafcc3aeb47d6ba014014ab42e283e5cf)
|
||||
|
||||
HE'S BACK !!!! 🐱
|
||||
|
||||
Part 1 : Weekly Recap
|
||||
|
||||
After a long week-end everybody was excited for opening of the casino and not only did we get an awesome week, we got a long awaited DFV tweet on tuesday.
|
||||
|
||||
We took the most bullish path into the strong move I predicted last week, kissing 294$ in what seemed like an unstopabble thrust , until an absolute BRUH MOMENT put a screeching STOP to our momentum when it was clear APES were in total control. If you saw what happened live it almost seemed unreal. *AMC* halt *and we began what seemed like a clear move to 300$+ only to be shutdown a second before.* It was very nasty to watch, but on a positive note it was a pure FLEX from $GME. The rest of the week was pretty quiet and friday ended up being like every friday (a slow bleed) by market makers to stop as many Call Options to go BRRRR$$.
|
||||
|
||||
Nevertheless it was an epic week for the most part, proud of all of you APES STILL BUYING AND HODLING !!!! 🚀🚀🚀🚀🚀
|
||||
|
||||
[](https://preview.redd.it/m4y6wlyevi371.png?width=1016&format=png&auto=webp&s=66ccf7ac1f0dba3defd622b8fdefd71e0cd9301c)
|
||||
|
||||
Higher highs lower lows , PERFECT !!!
|
||||
|
||||
[](https://preview.redd.it/jlbbs5ndvi371.png?width=174&format=png&auto=webp&s=abcc159f9ce630cf90d5ad0efe18210380b3678d)
|
||||
|
||||
🚀 294$
|
||||
|
||||
[](https://preview.redd.it/ic5qz6ltxi371.jpg?width=400&format=pjpg&auto=webp&s=87f64fa2f79a49ee66548a896abacd2882975dff)
|
||||
|
||||
NAKED SHORT , YAH !!!
|
||||
|
||||
Part 2 : Trend / Elliot Waves / Fibonaccis
|
||||
|
||||
The higher highs and lower lows we are setting on the current trending move looks very good and healthy, not much to say about that except to watch carefully if this continue to develop into next week, if we remain above 240$ for the rest of next week consider us extremly bullish.
|
||||
|
||||
Last week I talked about Elliot Waves and how we would dip a bit an then our next move would be fucking amazing and it was IMO taking us all the way from 226$ to nearly 300$ in a short trading week. In believe we completed wave 1 - 2 - 3 this week and possibly 4, this will be confirmed very soon. Don't forget 6/9 although hard to quantify, might have very positive effect on the price action.
|
||||
|
||||
Below you will find crayon drawings with all my scenarios. I used fibs to give me more accurate price target and levels to watch for.
|
||||
|
||||
[](https://preview.redd.it/05gzppikyi371.png?width=778&format=png&auto=webp&s=e26cc22cb41fd0501bd854698a69057d17bc2b06)
|
||||
|
||||
Last week prediction, things turned out even more BOOLISH than I thought.
|
||||
|
||||
[](https://preview.redd.it/ufq60x34zi371.png?width=1031&format=png&auto=webp&s=89f27a7a7bf96e5e71418d653fe4540dc78e21c6)
|
||||
|
||||
My favorite scenario; a bounce of that .618 Fib from this week move up, straight into the 5th wave reaching 300$+++
|
||||
|
||||
[](https://preview.redd.it/es8xla8ezi371.png?width=1005&format=png&auto=webp&s=21ac74f44fcd8fd1f0d5d0f2ae5babf0062cf0b8)
|
||||
|
||||
Possible 290+$ EOW ? 390ISH$ is the target nevertheless .
|
||||
|
||||
[](https://preview.redd.it/j7ua6fym1j371.png?width=784&format=png&auto=webp&s=1e5e9b9f5b9cb4c05d46fc5fde35e2d72a539040)
|
||||
|
||||
This scenario isn't as bullish but we could end up catching ourselves lower and bounce off 235$ or even as low as 220 into 300$+++. STILL STUNNING 🚀
|
||||
|
||||
NEVER FORGET, WEN IN DOUBT ZOOM OUT O_O
|
||||
|
||||
[](https://preview.redd.it/vkejg23s8j371.png?width=642&format=png&auto=webp&s=e4687b945bd6b5628842b1a14a62972d4f7b0a11)
|
||||
|
||||
FUCK I LOVE THIS STONK
|
||||
|
||||
Part 3 : TLDR , Price Prediction and Entry level.
|
||||
|
||||
TLDR :\
|
||||
Wanted to keep things as brief as possible in this edition because next week is right around the corner and I don't want to speculate too much since 6/9 (lul) good or bad will most def. have an impact on the stonk. But nevertheless I still think we will start trading near 300$ very very soon.
|
||||
|
||||
Expect more of the same by hedgies, but it's getting harder and harder for them to short us. Because make no mistake if they could they would take us back to 118$ no doubt (STILL GOT PTSD FROM THAT DAY)
|
||||
|
||||
AS ALWAYS BUY + HODL 🦍
|
||||
|
||||
I would tell you to vote but.. if you havent by now WTF ???
|
||||
|
||||
Can't wait for the vote count to be released. O_O
|
||||
|
||||
HYPED UP TO THE MAXIMUM LFG
|
||||
|
||||
Best entry point for next week :
|
||||
|
||||
~~187$~~ ~~(unlikely)~~ MUST BUY !!!!!!!
|
||||
|
||||
220-227$ (God tier)
|
||||
|
||||
237$ (Decent if available)
|
||||
|
||||
245 - 250 $ (if you are impatient or just want to buy now ) -
|
||||
|
||||
265$-275$ (If it starts ripping)
|
||||
|
||||
Updated price target for GME 2021 :
|
||||
|
||||
June : 220 - 260+ (strong resistance at 250)
|
||||
|
||||
July : 280 - 350+ (Picking up some APES along the way)
|
||||
|
||||
August : 350+ - 500$ (This is where they will use the aces up their sleeve)
|
||||
|
||||
September : 500$ (huge battle) - ♾ INFINITY $ (GG REKT)
|
||||
@ -0,0 +1,169 @@
|
||||
wen moon 7 : The Show Must Go On (Earnings/TA/Prices+Entries)
|
||||
=============================================================
|
||||
|
||||
| Author | Source |
|
||||
| :-------------: |:-------------:|
|
||||
| [u/MOSfriedeggs](https://www.reddit.com/user/MOSfriedeggs/) | [Reddit](https://www.reddit.com/r/Superstonk/comments/nx3wjr/wen_moon_7_the_show_must_go_on/) |
|
||||
|
||||
---
|
||||
|
||||
[DD 👨🔬](https://www.reddit.com/r/Superstonk/search?q=flair_name%3A%22DD%20%F0%9F%91%A8%E2%80%8D%F0%9F%94%AC%22&restrict_sr=1)
|
||||
|
||||
Greetings to all APES from around the 🌎🚀 in light of the recent events regarding price action and the massive FUD campaign orchestrated agaisnt us by the legacy media and shills, I have decided to post this DD ahead of schedual to try and make people less prone to FUD by taking the focus away from emotions back the to the numbers and the current trajectory we are on at the moment. The more detached we stay from our emotions in trading the better IMO. Shills want you to be emotional, they want you to feel isolated and down, I will explain how they do it and how to avoid falling into their trap. In this DD I've also included alot of TA because if there's one thing I will always trust, it's my tools. The rest is noise and B.S.
|
||||
|
||||
PART 1 : FUD CAMPAIGN + 5M share offering ATM
|
||||
|
||||
*FUD CAMPAIGN*
|
||||
|
||||
One of the oldest trick in the book from Wallstreet and their agents is to dip the price on earnings day, not only for GME but for alot of other stock aswell. Earnings create alot of FUD in some investors over a short period of time and they love to capitalize on that for their own personal agenda. They will have their articles ready, massively short the stock and will have shills spread disinformation online. Yesterday we saw this textbook play unfold in front of our eyes.
|
||||
|
||||
I want you to pay attention to the graph below these two FUD articles , you will see that Gamestop diped on every (E) day because of manipulation and paper handed bitches, only to come back stronger afterward. Again, toying with people emotions on the short term to get them to panic. Stock price improved in between every earning why would it be different this time ?
|
||||
|
||||
[](https://preview.redd.it/glfsljdjyi471.png?width=706&format=png&auto=webp&s=2455b1b761f789d6decce2cb764b0296ea69fa0e)
|
||||
|
||||
I'm sure this is what happened
|
||||
|
||||
[](https://preview.redd.it/twdd8pdhyi471.png?width=681&format=png&auto=webp&s=4521bbb9ee6b1ef0da7acb0ccb391e2be0edd6e5)
|
||||
|
||||
420K Followers on SS alone.
|
||||
|
||||
[](https://preview.redd.it/6u2livxc0j471.png?width=674&format=png&auto=webp&s=c44a7154a869848e81bde56934c6255e8858f647)
|
||||
|
||||
Stock price improved in between every earning why would it be different this time ? Especially with the new team we've got at GME.
|
||||
|
||||
*5M share offering ATM*
|
||||
|
||||
Shills pushed the narrative that this was bad for us, I want you to listen to this amazing [video](https://youtu.be/etuR9yOyE_s?t=60) by Tradespotting where he debunks that narrative completly. Brilliant, if you are feeling worried about those 5M shares watch the video.
|
||||
|
||||
Direct link :
|
||||
|
||||
<https://youtu.be/etuR9yOyE_s?t=60>
|
||||
|
||||
[](https://preview.redd.it/p6fmynu01j471.png?width=731&format=png&auto=webp&s=5404cdb6e567d4431150bea7cb5df182a7e85628)
|
||||
|
||||
It's over, pack it up guys.
|
||||
|
||||
PART 2 : WEN IN DOUBT ZOOM OUT + exponential floor tracking chart (credit : [u/JTH1](https://www.reddit.com/u/JTH1/))
|
||||
|
||||
Another strategy used by shills and other clowns hiding in the deepest corner of the meltdown subreddit will be to Zoom-in and use stupid line charts to make you doubtful.
|
||||
|
||||
*''See bagholders GME is going down, sell now before you lose everything''*
|
||||
|
||||
They want you to think about today's drop and fuck with your emotions , they want you to forget this incredible period of accumulation, the incredible and growing community of APES, the complete overhaul of the company, DFV still holding with us, and real TA like what i'm about to show you . We will never ever give up, we buy and we hodl the plan hasn't changed. 🚀
|
||||
|
||||
*''it's a failing brick and mortar stock and the stock going back to 40$''*
|
||||
|
||||
come again f*** head I haven't heard this one before.
|
||||
|
||||
[](https://preview.redd.it/i9etzlfv4j471.png?width=460&format=png&auto=webp&s=cc4c3a1984a586db9e520194c0e576cfce3fee66)
|
||||
|
||||
Well well well, I wonder what's behind 350$.
|
||||
|
||||
William O'Neil's Cup with Handle is a bullish continuation pattern that marks a consolidation period followed by a breakout. ... The cup forms after an advance and looks like a bowl or rounding bottom 👇👇👇👇👇👇👇👇👇👇👇👇👇👇👇👇👇👇👇👇👇👇👇👇👇👇👇👇👇👇👇👇👇👇👇👇👇👇👇👇👇👇👇👇
|
||||
|
||||
[](https://preview.redd.it/00jjf8jh5j471.jpg?width=677&format=pjpg&auto=webp&s=089672920eaafde2fc02f4ca51aa8a1e8befb95a)
|
||||
|
||||
Classic Cup and handle
|
||||
|
||||
[](https://preview.redd.it/ieyyo7555j471.png?width=689&format=png&auto=webp&s=da349a37b61afce9470fbeda64972ffc6b59ac99)
|
||||
|
||||
Who doesn't like a cup of joe in the morning. BULLISH !
|
||||
|
||||
[](https://preview.redd.it/tjup54mx1j471.png?width=1664&format=png&auto=webp&s=227767c33014ab42b7570f5ee3e114100f81a4a0)
|
||||
|
||||
Ask yourself this question, did today really mattered in the grand scheme of things ?
|
||||
|
||||
PART 3 : Fibonaccis
|
||||
|
||||
In the section below you will find historical fibs from GME, it's crazy how accurately it predicted the future, this is one of my favorite tool to use to see what might happen next with the price action. Because of all the people who use the Fibonacci tool, those levels become self-fulfilling.
|
||||
|
||||
*See for yourself.*
|
||||
|
||||
Retracement :
|
||||
|
||||
Fibonacci retracement levels are horizontal lines that indicate the possible support and resistance levels where price could potentially reverse direction.
|
||||
|
||||
Pay attention to this pattern repeating itself over and over on GME , every time there's a major dip we bounce of the .5 fib and use the subsequent .236/.382 as our support and we consolidate there, this is bullish.
|
||||
|
||||
*All time high -*
|
||||
|
||||
[](https://preview.redd.it/d6jkfae26j471.png?width=838&format=png&auto=webp&s=ef554f378d3c87f84a300dd0c96cc62dbbf5317d)
|
||||
|
||||
Price bounced off the .5 from our all time high ! .236 has become an amazing support level for us, impossible to break for the hedgies.
|
||||
|
||||
*MARCH -*
|
||||
|
||||
[](https://preview.redd.it/577m0mr17j471.png?width=784&format=png&auto=webp&s=304e8887ca4b01f5f84f1e147432bd178c6cfd3e)
|
||||
|
||||
.5 Bounce , using .236 and .382 as support
|
||||
|
||||
June -
|
||||
|
||||
[](https://preview.redd.it/0zyu83rg8j471.png?width=1164&format=png&auto=webp&s=c82b94090a48951d0201ce52a2119222e1f2cf99)
|
||||
|
||||
Once again price bounced off the .5 and will try to break out the prior .233 / .382 support.
|
||||
|
||||
Now that have identified our lows lets look at our future highs using the extension tool.
|
||||
|
||||
Fibonaccis Extention
|
||||
|
||||
Fibonacci extensions are a tool that traders can use to establish or estimate how far a price may travel after a retracement is finished.
|
||||
|
||||
All time -
|
||||
|
||||
*The ideal extension from our all time is somewhere between 500 - 900$ I will demonstrate how it will happen in the next section using Elliot Wave.*
|
||||
|
||||
[](https://preview.redd.it/vbrv2br69j471.png?width=983&format=png&auto=webp&s=b7f26d83b6b64be57b9cc33905c03ea1c51f203b)
|
||||
|
||||
This is where GME is going next 500+ - 800+$, since we broke the .236 on our move up reaching the .618 seems inevitable to me.
|
||||
|
||||
JUNE
|
||||
|
||||
*Same logic applies here, once we break the .236 we will get a higher high between the .5 / .618 fib a.k.a 350+$*
|
||||
|
||||
[](https://preview.redd.it/mqagm1599j471.png?width=1178&format=png&auto=webp&s=8b19187cb23cc56532e038ff8b0950b836242e56)
|
||||
|
||||
Same logic apply to our latest move up , we pull back and then bounce back.
|
||||
|
||||
Part 3 : ELLIOT WAVE
|
||||
|
||||
I've talked alot about Elliot wave in my previous DD, I like this theory even thought it's more useful to daytrader it can help us see the path ahead. On the first picture you will see the prediction made last week by Youtuber Trading Sciences, as you can see he was pretty close. The green lines show the actual updated price.
|
||||
|
||||
On the second frame you will my own prediction with the updated price of today.
|
||||
|
||||
Wave 1 (completed) 135 - 344 - Wave 2 (completed) 344 - 211 - Wave 3 (forming) 211 - 483 - Wave 4 (prediction) 344 - 800$
|
||||
|
||||
[](https://preview.redd.it/6ggx4evvaj471.png?width=582&format=png&auto=webp&s=c28e4dadd75bd529b723569707550608f71f9495)
|
||||
|
||||
Prediction made last week by Trading Sciences, pretty accurate.
|
||||
|
||||
[](https://preview.redd.it/8bvug8e8bj471.png?width=961&format=png&auto=webp&s=3f1fcfc12b7d3ef77d4e9ee062e80517c0283e58)
|
||||
|
||||
Look out Ken, the rocket is coming your way
|
||||
|
||||
Part 4 : TLDR , Price Prediction and Entry level.
|
||||
|
||||
Hope I've given you a few wrinkles with this one.
|
||||
|
||||
Buy + HODL ignore the noise, focus on the numbers and never forget we are an ever growing global community full of loving people who got each other's back. 🚀🦧\
|
||||
APES STRONG TOGHETER.
|
||||
|
||||
Shills will never divide us.
|
||||
|
||||
Best entry point for next week : 🚀
|
||||
|
||||
Anything below 250$/260$ is a decent buy
|
||||
|
||||
anything below 220$ is s+ tier
|
||||
|
||||
if push comes to shove anything below 200$ is god tier.
|
||||
|
||||
*Updated price target for GME 2021 :* 🚀
|
||||
|
||||
June : -220 - 350 (Max)
|
||||
|
||||
July : 280 - 350+ (Epic Battle for 350$)
|
||||
|
||||
August : 350+ - 500 (Huge battle)
|
||||
|
||||
September : 500 (huge battle) - ♾ INFINITY $ (GG REKT)
|
||||
@ -0,0 +1,157 @@
|
||||
wen moon 8 : To infinity and beyond (TA/MOASS/Prices+Entries)
|
||||
=============================================================
|
||||
|
||||
| Author | Source |
|
||||
| :-------------: |:-------------:|
|
||||
| [u/MOSfriedeggs](https://www.reddit.com/user/MOSfriedeggs/) | [Reddit](https://www.reddit.com/r/Superstonk/comments/o3qqqj/wen_moon_8_to_infinity_and_beyond/) |
|
||||
|
||||
---
|
||||
|
||||
[DD 👨🔬](https://www.reddit.com/r/Superstonk/search?q=flair_name%3A%22DD%20%F0%9F%91%A8%E2%80%8D%F0%9F%94%AC%22&restrict_sr=1)
|
||||
|
||||
🌎🚀
|
||||
|
||||
INTRO :
|
||||
|
||||
As I was doing my usual end of the week technical analysis in preparation for my weekly DD I believe I've finally put all the pieces of the puzzle togheter. I could have called this ''ENDGAME'' or whatever but I don't think we are there just yet.
|
||||
|
||||
I also want to manage people's expectation as this is only my opinion and technical analysis**, not financial advice** or a guarantee by any mean, still I think it's extremely telling of what's to come next.
|
||||
|
||||
When you combine this information with Criand's latest [DD](https://www.reddit.com/r/Superstonk/comments/o0scoy/the_bigger_short_how_2008_is_repeating_at_a_much/) and dentisttft T+35 [theory](https://www.reddit.com/r/Superstonk/comments/o155a6/t35_is_the_one_true_cycle_evidence_to_back_my/) the information and data i'm about to show you becomes an inevitability and a self fulfiling prophecy.
|
||||
|
||||
What is my theory ? 🧠
|
||||
|
||||
*I BELIEVE GME is on the verge of making another spectacular parabolic move whiping out the shorts*\
|
||||
*and in the process, bringing us into tendieland. Sit back relax and prepare yourself for take off !* 🚀
|
||||
|
||||
[](https://preview.redd.it/sjwwftsa2a671.jpg?width=2753&format=pjpg&auto=webp&s=12973d659dabe61f7d1f215ea81cdac3249d1a26)
|
||||
|
||||
BUCKLE UP !
|
||||
|
||||
PART 1 : Technical Analysis
|
||||
|
||||
MACD ( Moving Average Convergence Divergence )
|
||||
|
||||
I believe by the end of this week / beggining of next week, the MACD is gonna crossover signaling the end of a very weak downtrend. When looking at the past we can see that GME MACD doesn't really like to stay solid red for more than 5 days and has been very bullish for a long time now.
|
||||
|
||||
Keep in mind that it is a very popular indicator used by many traders and will spark interest in people who were waiting to get in.
|
||||
|
||||
[](https://preview.redd.it/tb3kvfee6a671.png?width=409&format=png&auto=webp&s=d08713fe3562390ebbe60c9d0023025f41895b61)
|
||||
|
||||
MACD 🖍️
|
||||
|
||||
(*RSI*) *Relative Strength Index*
|
||||
|
||||
As you can see on the picture below, $GME always bounces of the 39 to cross 50 (neutral) and finally 70 (overbought) .
|
||||
|
||||
What does this mean ?
|
||||
|
||||
No one is selling on downtrend except a few paper hands and daytraders, so the dip are mostly artificial and weak the stock always bounces back and create a new floor for itself.
|
||||
|
||||
I think we will get a little dip before exploding again like we always do as you can see GME wants to\
|
||||
break 350$ so bad, but it is being artificially kept down.
|
||||
|
||||
[](https://preview.redd.it/xmw6nz6g8a671.png?width=564&format=png&auto=webp&s=f7b8b06652162398a4bf5d3f7f366b9a148f06ac)
|
||||
|
||||
RSI 🖍️ Past vs Future
|
||||
|
||||
Volume
|
||||
|
||||
*Trading volume* is a measure of how much of a given financial asset has *traded* in a period of time.
|
||||
|
||||
The volume we are seeing now is very similar to the kind of volume we saw before things really started to pick up, by itself it doesn't say much but when you tie it up with the rest of indicators it paints a clearer picture.
|
||||
|
||||
[](https://preview.redd.it/dkdskk3g9a671.png?width=843&format=png&auto=webp&s=8d7cf53e4ee8a132fa66bc780980b057f598cf9a)
|
||||
|
||||
Volume is similar to pre-january run up 🚀
|
||||
|
||||
Uptrend
|
||||
|
||||
"What happens when an unstoppable force meets an immovable object?
|
||||
|
||||
I guess we will find out pretty soon, but I think this resistance is about to be broken the same way it was broken back in january, as you can see below the candlestick trend is very similar to the pre-january run up.
|
||||
|
||||
[](https://preview.redd.it/tm515t3aaa671.png?width=666&format=png&auto=webp&s=b705b1ee0c4bf10dc39c1a19ec821fe9eef5abec)
|
||||
|
||||
The irresistible force paradox
|
||||
|
||||
FIBONACCI
|
||||
|
||||
is a naturally occurring pattern.\
|
||||
The golden ratio (1.618) describes predictable patterns on everything from atoms to huge stars in the sky. The ratio is derived from something called the Fibonacci sequence. The Fibonacci Sequence is a peculiar series of numbers from classical mathematics that has found applications in advanced mathematics, nature, statistics, computer science,
|
||||
|
||||
Retreacement :
|
||||
|
||||
Fibonacci Retracements are ratios used to identify potential reversal levels
|
||||
|
||||
Retracements in the 38.2%-50% range would be considered moderate.
|
||||
|
||||
[](https://preview.redd.it/qdy5nkj9ca671.png?width=532&format=png&auto=webp&s=4650224e4a44ce625f957b93fadf3156cfc8e9ae)
|
||||
|
||||
A retreacement to .5 is B O O L I SH IMO 🚀
|
||||
|
||||
Extension
|
||||
|
||||
The Fibonacci extensions show how far the next price wave could move following a pullback.
|
||||
|
||||
As demonstrated below, even without the MOASS GME had the potential to reach an all-time high of 1.6M$ per share. (4.236 fib)
|
||||
|
||||
in my opinion we could definetly say that MOASS officialy starts past the 4.236 fibonnaci or 1.6M$.
|
||||
|
||||
As you can see once we get past 2K$ , 27K$ , 300K$ and 1.6M$ we can officialy consider we are past all reasonable and possible prices.
|
||||
|
||||
Don't get fooled if we reach these prices this isn't the squeeze so beware, people will most likely take profits in these area.
|
||||
|
||||
[](https://preview.redd.it/6o4mc6xaca671.png?width=809&format=png&auto=webp&s=6f6fab74419d912053fd8a4b44bcdd2a40953580)
|
||||
|
||||
Even without MOASS $GME got insane upside potential based on fibs ($)
|
||||
|
||||
ELLIOT WAVE
|
||||
|
||||
This is a scenario of what our road to margin calls could look like, I drew these quickly but if you want more information you can read this excellent [DD](https://www.reddit.com/r/Superstonk/comments/nwyj77/elliot_waves_and_gme_why_im_jacked_to_infinity/) by Elliot Wave guy himself.
|
||||
|
||||
this information correlate perfectly with [Trading Sciences TA](https://youtu.be/BWNGUpy6_bI?t=70) on ELLIOT WAVE who predicted AMC's 75$ using this technique.
|
||||
|
||||
JACKED !!!! 🚀
|
||||
|
||||
[](https://preview.redd.it/hy0r8a7daa671.png?width=560&format=png&auto=webp&s=2f23c0b9c4c1e935059274838e79249fef40a8f6)
|
||||
|
||||
Elliot Wave Theory
|
||||
|
||||
PART 2 : Road to MOASS (Putting all the pieces togheter 🧩)
|
||||
|
||||
LFG !!!! 🚀 now that i've explained my theory using multiple indicators and other people DD and TA , let's put all the pieces 🧩 togheter shall we. This is my final conclusion , our road to MOASS. so if you are wondering ''Wen Moon'' this is how we could do it.
|
||||
|
||||
As for when ????? I'll let you know at the very end.
|
||||
|
||||
Once again ; WHEN we get past 2K$ , 27K$ , 300K$ and 1.6M$ we can officialy consider we are past all reasonable and possible prices. This will be MOASS.
|
||||
|
||||
As for margin 📞 ? I think it's clear the area between 350$ and 800$ is extremly sketchy for hedgies, they will do everything in their power to keep us from going there. They never covered, and they will pay.
|
||||
|
||||
[](https://preview.redd.it/4t44eo8eca671.png?width=744&format=png&auto=webp&s=7dcdb6f4fee520fa5b63e45281d05dad87e02276)
|
||||
|
||||
Putting all the pieces togheter 🧩 MOASS BABY LFG!!!
|
||||
|
||||
PART 3 : TLDR + Entries and price prediction
|
||||
|
||||
TLDR : BUY AND HODL FOR YOUR LIFE !!!!! Honestly you could just look at the picture in PART 2 to get jacked but I recommend you read everything and try to understand, this is huge and very important information.
|
||||
|
||||
BIG shout-out to everybody who contributed to the community in any way shape or form.
|
||||
|
||||
Best entry point for next week (21/25) : 🚀
|
||||
|
||||
197$ - GOD TIER\
|
||||
207$ - Really good\
|
||||
220$ - Decent\
|
||||
233$ - Buy at resistance\
|
||||
250+$ - If it starts to RIP
|
||||
|
||||
*Updated price target for GME 2021 :* 🚀
|
||||
|
||||
June : 197 - 300
|
||||
|
||||
July : 280 - 350+ (Epic Battle for 350$)
|
||||
|
||||
August : 350+ - 500 (Fight for Margin Call ZONE) 📞
|
||||
|
||||
September / November : 400 - 800 (huge battle in margin call ZONE ) 📞 - ♾ INFINITY $ (GG REKT)
|
||||
@ -0,0 +1,149 @@
|
||||
wen moon 9 : Astrology ► TA + Updates
|
||||
=====================================
|
||||
|
||||
| Author | Source |
|
||||
| :-------------: |:-------------:|
|
||||
| [u/MOSfriedeggs](https://www.reddit.com/user/MOSfriedeggs/) | [Reddit](https://www.reddit.com/r/Superstonk/comments/o92ziv/wen_moon_9_astrology_ta_updates/) |
|
||||
|
||||
---
|
||||
|
||||
[DD 👨🔬](https://www.reddit.com/r/Superstonk/search?q=flair_name%3A%22DD%20%F0%9F%91%A8%E2%80%8D%F0%9F%94%AC%22&restrict_sr=1)
|
||||
|
||||
watup apes 🍌🦍 , I know last week was a boring week for the price action but as always a ton of development occured. I want to thank everyone in this community who's doing their fair share. Memes, DD, TA , Shitpost we're all contributing one way or the other. 🍌🦍
|
||||
|
||||
Edit : deleted link to other sub
|
||||
|
||||
[](https://preview.redd.it/qfwk84816v771.png?width=688&format=png&auto=webp&s=c78cda1f8d2d45970c95aa63e374ddeb0e1df920)
|
||||
|
||||
PART 1 : Update ( GME 🚀 VS AMC 🍿) ☕
|
||||
|
||||
*Direct link to my previous post :* <https://www.reddit.com/r/Superstonk/comments/o5bdhr/gme_possible_500_move_very_soon_gme_vs_amc/>
|
||||
|
||||
This is an update of this [post](https://www.reddit.com/r/Superstonk/comments/o5bdhr/gme_possible_500_move_very_soon_gme_vs_amc/) I made last week ;
|
||||
|
||||
Long story short me and other people namely Elliot Wave guy theorized that GME and AMC were following very similar patterns ever since January. The one that interest us the most is the recent cup and handle breakout by AMC, I would love to see the same thing play out on GME. As you will see on the pictures below we are only a few days away from this possible break out, if things play out like they did with AMC we could be looking at a potential 800% move up.
|
||||
|
||||
FYI : There is 37,734 OPEN INT CALL OPTIONS FOR JULY 16 on the 800$ strike. 🤔🤔🤔🤔🤔🤔
|
||||
|
||||
CRAZY 🚀
|
||||
|
||||
***Nota Bene : in my previous post I gave precise dates and I now realize.. that it's frowned upon so I won't do it anymore.***
|
||||
|
||||
[](https://preview.redd.it/x3skp5985v771.png?width=724&format=png&auto=webp&s=c541b6400ae0fec7e6e8faf4bb70b0b0fee1b9fe)
|
||||
|
||||
American entrepreneur William J. O'Neil defined the cup and handle (C&H) pattern in his 1988 classic, "How to Make Money in Stocks,"
|
||||
|
||||
[](https://preview.redd.it/rer9nfnc5v771.png?width=759&format=png&auto=webp&s=87425b6df16b40e464c5ec14575d4fbb2a6d7503)
|
||||
|
||||
GME cup and handle possible breakout 🚀
|
||||
|
||||
[](https://preview.redd.it/dumjbfmj5v771.png?width=1267&format=png&auto=webp&s=00d6a38344038c8e11b547519ee7e9fcb6002b8d)
|
||||
|
||||
GME 🚀 vs Sticky floor company head to head comparison
|
||||
|
||||
Be on the lookout for a breakout on the handle part of the cup, this would create massive amount of FOMO.
|
||||
|
||||
WHY you may ask ?
|
||||
|
||||
Retards on WSB have also figured it out, as i'm writing a similar analysis is sitting on the front page of WSB.
|
||||
|
||||
B O O L I S H 🚀 ☕
|
||||
|
||||
Part 2 : Technical Analysis
|
||||
|
||||
MACD (Prediction vs Reality) ✔️
|
||||
|
||||
As predicted, the downtrend is getting weaker on the MACD, very boolish.
|
||||
|
||||
Soon as this baby turns green and crossover we're heading for our breakout. 🚀
|
||||
|
||||
[](https://preview.redd.it/mhowwu3m5v771.png?width=772&format=png&auto=webp&s=57095decca46962166f9c36d92a71e487be173e5)
|
||||
|
||||
Last week prediction vs what happened
|
||||
|
||||
RSI ✔️
|
||||
|
||||
As you can see below if we compare the strenght on the RSI and past price action we can see the zone we're in at the moment signify that pressure is building up leading to another take off from our rocket.
|
||||
|
||||
With just a little bit more consolidation and fuel for our rocket we should be ready to go up again 💥
|
||||
|
||||
. ignition sequence start ...
|
||||
|
||||
AGAIN ; BOOLISH 🚀
|
||||
|
||||
[](https://preview.redd.it/7o650sin5v771.png?width=646&format=png&auto=webp&s=6c8cdb59c5f01c6b6c99b76dc3fdc41a446e597d)
|
||||
|
||||
Pressure is building up baby🚀🚀🚀
|
||||
|
||||
EMA (exponential moving average) 20 / 50 / 100 / 200 ✔️
|
||||
|
||||
The exponential moving average (EMA) is a technical chart indicator that tracks the price of an investment over time and that gives more weighting or importance to recent price data.
|
||||
|
||||
As you can see below everything looks really good on the weekly timeframe no weird crossover or anything, very satisfying to look at,
|
||||
|
||||
On the daily timeframe we got under the 20 to worry about really as the last time that happened we only consolidated for a bit and bounced back from the 50, see for yourself on the second image.
|
||||
|
||||
My verdict ; B O O L I SHHH 🚀 🍌🦍
|
||||
|
||||
[](https://preview.redd.it/otkf60lo5v771.png?width=446&format=png&auto=webp&s=792868d3aad4d2a7e92d103048c21ec17c70b714)
|
||||
|
||||
WEEKLY EMA ; looking hella good :D
|
||||
|
||||
[DAILY ; looking good aswell, potential bounce off the 50 EMA (yellow line)](https://preview.redd.it/zbhypufnku771.png?width=808&format=png&auto=webp&s=77a616c2b84f4e28ea142aa20ddffe8163443792)
|
||||
|
||||
[](https://preview.redd.it/2p8ijobp5v771.png?width=808&format=png&auto=webp&s=556c42958ec1d9b2a8f145f449caa3aa3c614578)
|
||||
|
||||
DAILY ; looking good aswell, potential bounce off the 50 EMA (yellow line)
|
||||
|
||||
Fibonacci ✔️
|
||||
|
||||
In the near future those the prices you have to look out for, I expect some kind of fight at every one of those price point. Once we reclaim the 260/277$ HO IT'S ON BABY 🦍
|
||||
|
||||
ON THE SECOND FRAME YOU WILL SEE THAT TO CONSIDER WE HAVE CONFIRMED OUR BULLISH BREAKOUT WE NEED TO OPEN AND CLOSE SOMEWHERE AROUND 243 - 260 $. From there you might see crazy FOMO KICKING AND and indicators going haywire.
|
||||
|
||||
[Prices to look for IN the upcoming future !!](https://preview.redd.it/a3lvwkyxlu771.png?width=490&format=png&auto=webp&s=d149496d7484c6ddb8950d0f4e5a7e539a957e57)
|
||||
|
||||
[](https://preview.redd.it/5qiv9k5q5v771.png?width=490&format=png&auto=webp&s=885d7d34e4287b96d859b6e01a6a9157b5fa976d)
|
||||
|
||||
Prices to look for IN the upcoming future !!
|
||||
|
||||
[fibs to look for in a possible breakout](https://preview.redd.it/e5u7auiwmu771.png?width=582&format=png&auto=webp&s=4e785426dffb398a41abdc3bee69f5fe96700eb8)
|
||||
|
||||
[](https://preview.redd.it/vld5j81r5v771.png?width=582&format=png&auto=webp&s=84e3338b773659f61da7f8f07dd25780b32684ea)
|
||||
|
||||
fibs to look for in a possible breakout
|
||||
|
||||
Uptrend (updated) ✔️
|
||||
|
||||
"What happens when an unstoppable force meets an immovable object?
|
||||
|
||||
the clash of the century, the unbreakable 350$ WALL ! Or is it realy unbreakable ????
|
||||
|
||||
🦍 OOK OOK
|
||||
|
||||
[](https://preview.redd.it/adq1ct9u5v771.png?width=757&format=png&auto=webp&s=4b09f05931d67d6d3e90a1bb393a16afb639f3b6)
|
||||
|
||||
HO brother... 😎
|
||||
|
||||
[The Gameplan is still the same baby nothing changed 😎](https://preview.redd.it/ihuzwcdjou771.png?width=744&format=png&auto=webp&s=93bd3eb5e789454feca9a538db8654bfb1812cb0)
|
||||
|
||||
PART 3 : TLDR + Entries and price predictionLast week was boring but I expect a bit more action this week , nothing too crazy but I'd love to see up break past 250$ for many reasons. Again Buy and HODL 🚀 is the best strategy, but it's always interesting to dive in a bit deeper IMO. Below you will find the best prices to buy at this week and my predictions for the near future.
|
||||
|
||||
Best entry point for next week (28/2) : 🚀
|
||||
|
||||
177$ - YOU WISH\
|
||||
197$ - GOD TIER\
|
||||
207$ - Really good\
|
||||
224$ - Decent/ OK\
|
||||
245$ - MFW if we move past this price 😎\
|
||||
250+$ - I buy at every price but this isn't as optimal obviously
|
||||
|
||||
*Updated price target for GME 2021 :* 🚀
|
||||
|
||||
June : ~~197 - 300~~ ✔️
|
||||
|
||||
July : 210 - 350+ (Epic Battle for 350$)
|
||||
|
||||
August : (Fight for Margin Call ZONE) 📞
|
||||
|
||||
September / November : (huge battle in margin call ZONE ) 📞 - ♾ INFINITY $ (GG REKT)
|
||||
@ -0,0 +1,196 @@
|
||||
wen moon 10 : Endgame ■ Final TA
|
||||
================================
|
||||
|
||||
| Author | Source |
|
||||
| :-------------: |:-------------:|
|
||||
| [u/MOSfriedeggs](https://www.reddit.com/user/MOSfriedeggs/) | [Reddit](https://www.reddit.com/r/Superstonk/comments/od7swq/wen_moon_10_endgame_final_ta/) |
|
||||
|
||||
---
|
||||
|
||||
[DD 👨🔬](https://www.reddit.com/r/Superstonk/search?q=flair_name%3A%22DD%20%F0%9F%91%A8%E2%80%8D%F0%9F%94%AC%22&restrict_sr=1)
|
||||
|
||||
Hello everyone 🦍, this DD will be the last one I publish untill the squeeze hence the title Endgame. The reason is simple ; I strongly believe we are in the final stage of the battle with the crooked hedge funds and their agents.
|
||||
|
||||
In my humble opinion there is no reason for me to provide more technical analysis in the near future , or perhaps evidence for a squeeze. Hundreds of DD, countless data and hours of interview with some of the most brilliant mind and expert out there should be enough to convince you that ---
|
||||
|
||||
*The things set in motion cannot be stopped.*
|
||||
|
||||
🚀
|
||||
|
||||
[](https://preview.redd.it/scy5560z62971.jpg?width=680&format=pjpg&auto=webp&s=281e8a98155d94ac81294cdff04f76989c8de6ec)
|
||||
|
||||
It's been one hell of a journey from DFV first YOLO post to the recent and exciting development with the company and every crazy event 🍌 that happened in between.
|
||||
|
||||
I've had the time of my life sharing these DD and shitposting with you guys.
|
||||
|
||||
I'm ZEN as can be and I hope everyone else is.
|
||||
|
||||
at this point I think our hands are nothing but pure diamonds. 💎
|
||||
|
||||
🍻
|
||||
|
||||
*without further ado*, let's dive in...
|
||||
|
||||
PART 1 - Basic charting 🌙
|
||||
|
||||
Without using any indicators whatsover and just by looking at our daily chart things seem to be progressing well.
|
||||
|
||||
[u/chayse1984](https://www.reddit.com/u/chayse1984/) pointed out in his DD that GME are currently about to break out of a cup and handle while being inside of a bullish pennant.
|
||||
|
||||
For my smooth 🧠 out there it means we have roughly a 66% chance of breaking out on the upside to a bare minimum of about *450$.*
|
||||
|
||||
*(measurement from the bottom to the top of the cup on the log chart).*
|
||||
|
||||
What's also interesting to note; it would bring us exactly where Elliot Wave guy told us the 3rd wave would bring us. 👨💻 *(This was also double checked by Youtuber Trading Sciences;* [Source](https://www.youtube.com/watch?v=mHzT5JRMQCg)*)*
|
||||
|
||||
*When two different analysis made by numerous people point in a direction it's best to assume that these speculation have a very good chance of happening for the simple fact that it plays a key factor in the psychology of trading in individuals.*
|
||||
|
||||
[](https://preview.redd.it/h1xvyqp4c2971.png?width=698&format=png&auto=webp&s=306b06d329a9869e70eba7db6bbdcfe32f3e20e7)
|
||||
|
||||
Chart as analyzed by chayse and myself , cup and handle insine a bullish pennant supported by a trendline.
|
||||
|
||||
SOLVING THE CUP AND HANDLE
|
||||
|
||||
[](https://preview.redd.it/a5g0kt6bc2971.png?width=741&format=png&auto=webp&s=fc05fbab34daab3532572839be44ce1bccfa3ed6)
|
||||
|
||||
The first thing we need to find out is how the cup and handle will play out.
|
||||
|
||||
It's pretty normal for a cup and handle to retrace as much as 50% from their initial high before a blue sky breakout or in our case a trip to the moon. As illustrated below this would be the most possible scenario in my opinion, this would also trap bears causing even more buying pressure if the trend changes rapidly.
|
||||
|
||||
[](https://preview.redd.it/a4uhxj7dc2971.png?width=782&format=png&auto=webp&s=118d66144f615d53d7f0002a2cb195c11fed5613)
|
||||
|
||||
GME could go as low as 172$/173$ before breaking out.
|
||||
|
||||
This to me is another scenario also bullish but less probable, we could see the trend reverse itself as soon as monday and we would resume our journey to the top. Such a weak downtrend would indicate that shorts and bears are now completly powerless, *they don't even believe in their own thesis anymore.*
|
||||
|
||||
If GME remains above 200$ and start to break out by the end of the week, HOLY MOLY.
|
||||
|
||||
[](https://preview.redd.it/b0c2jzaec2971.png?width=767&format=png&auto=webp&s=3e79b8a76e5b1c44450c41ee48c8e7ff8ee975e2)
|
||||
|
||||
Hedgies are fucked
|
||||
|
||||
If you wish to understand more about Elliot Wave theory I recommend reading Elliot Wave Guy DD or watching this [video](https://www.youtube.com/watch?v=mHzT5JRMQCg).
|
||||
|
||||
[](https://preview.redd.it/g4njxx7ee2971.png?width=619&format=png&auto=webp&s=bfd23dfa77a134f60784811331a3208c14efa519)
|
||||
|
||||
Elliot Wave theory applied to GME
|
||||
|
||||
Now we can put all the pieces of the puzzle togheter and it look something like this, two different technique ; same result. Very bullish but also realistic and works perfectly in accordance with William O'Neil trading strategy about the cup and handle theory and Elliot Wave theory.
|
||||
|
||||
HODL 🚀
|
||||
|
||||
[](https://preview.redd.it/rbpqa4bke2971.png?width=833&format=png&auto=webp&s=a6493b2c5db7dd710900675ea97958f09ee16623)
|
||||
|
||||
O'neil + Elliot theory applied to $GME
|
||||
|
||||
If this is not enough to confirm your bias check out the next section. 😎
|
||||
|
||||
Part 2 - In depth T.A 🌙
|
||||
|
||||
MACD
|
||||
|
||||
Downtrend is getting weaker and weaker, bears are fucked. Just give it a little more time and this baby is gonna crossover like it always did in the past, as you can see everytime is crosses-over we raise our floor a little bit.
|
||||
|
||||
[](https://preview.redd.it/4ksqdy3bg2971.png?width=739&format=png&auto=webp&s=ccebebe38ad71b2ed7e0455100dbd88b0e79642a)
|
||||
|
||||
MACDADDY GETTING READY TO 🌊💧🍾
|
||||
|
||||
RSI
|
||||
|
||||
RSI on GME has a tendency to bounce of the median line (GREEN) and explode back up, right now we're consolidating but as you can see it's just a matter of time until it breaks out again, we can also confirm that the current downtrend is very weak and that APES are in control.
|
||||
|
||||
[](https://preview.redd.it/srx2tw6tg2971.png?width=790&format=png&auto=webp&s=165a54d289092b1b6cf209425bc64582a5217807)
|
||||
|
||||
Wow Kenny ! Is that the best you could do ?
|
||||
|
||||
EMA
|
||||
|
||||
*The exponential moving average (**EMA**) is a technical chart indicator that tracks the price of an investment (like a stock or commodity) over time. The* *EMA* *is a type of weighted moving average (WMA) that gives more weighting or importance to recent price data.*
|
||||
|
||||
The EMA on the weekly timeframe is looking great, the EMA on the daily timeframe reminds me of the way we traded back in march. Consolidating before a break out. Also BOOLISH LFGGGGG
|
||||
|
||||
WEEKLY EMA
|
||||
|
||||
[](https://preview.redd.it/hz8asvf5h2971.png?width=409&format=png&auto=webp&s=d479b70b780744c94219d935f2ad2d20a158bc55)
|
||||
|
||||
Weekly EMA looking stunning.
|
||||
|
||||
[](https://preview.redd.it/d7cx9xu9h2971.png?width=409&format=png&auto=webp&s=a81aa699795398ec13cd6d4cdef0e9824175b69a)
|
||||
|
||||
GME will most likely bounce off the 20 EMA on the WEEKLY and RIP
|
||||
|
||||
DAILY EMA
|
||||
|
||||
[](https://preview.redd.it/rntb080hh2971.png?width=633&format=png&auto=webp&s=79ea9cdc301bf902223254e799ba0f70dd9e69af)
|
||||
|
||||
Last time we traded in between the 20/50 EMA things went crazy afterward.
|
||||
|
||||
[](https://preview.redd.it/isvrvhlih2971.png?width=633&format=png&auto=webp&s=b8ab7235d4390e2bb229f7234fee1c365b1aef62)
|
||||
|
||||
Huu guys.. 🚀
|
||||
|
||||
VOLUME
|
||||
|
||||
Well I think everyone has noticed by now that the volume is drier than the Sahara desert. But fear not, this is very similar to what happened back in July.
|
||||
|
||||
Low volume pullback like this are very attractive to investors as they present low risk high rewards scenario.
|
||||
|
||||
In simple term FOMO will be kicking in soon, and the people who didn't buy this will be mad because it's pretty much the last chance you've got at buying GME at a some ''reasonable price''.\
|
||||
I'm sure if you could bo back in time and buy at 4$ / 40$ you would go all in, don't miss out again. Because you might never see the low 200's ever.
|
||||
|
||||
*Also I'd like to point out how similar the chart is looking to the previous run up to 75$ from last summer.*
|
||||
|
||||
This isn't financial advice, just common sense.
|
||||
|
||||
[](https://preview.redd.it/birhh679i2971.png?width=726&format=png&auto=webp&s=553bb5556eeb011dcad21b0c9546b03ac60b2cc1)
|
||||
|
||||
''awww man.. I wish I would have bought at 200$ but I wasn't sure I mean GME is a dying company on paper, right guys ? '' - Some fundamental investor
|
||||
|
||||
BOLLINGER BANDS
|
||||
|
||||
*Bollinger bands* *help determine whether prices are high or low on a relative basis. They are used in pairs, both upper and lower* *bands* *and in conjunction with a moving average.*
|
||||
|
||||
The Squeeze
|
||||
|
||||
The squeeze is the central concept of Bollinger Bands®. When the bands come close together, constricting the moving average, it is called a squeeze. A squeeze signals a period of low volatility and is considered by traders to be a potential sign of future increased volatility and possible trading opportunities.
|
||||
|
||||
The superstonk is about to go BRRRRRRRRRRRRRRRRRR , the chart is screaming BUY ME alot of people will miss out on life changing money because ''mUh DyInG BrIcK aNd MoRtaR StorE'' .
|
||||
|
||||
[](https://preview.redd.it/39k62cqoi2971.png?width=884&format=png&auto=webp&s=21b0faa672bd57dfc8a718789e0141f866874690)
|
||||
|
||||
HVP by Bali Purr (Historical Volatility Percentile)
|
||||
|
||||
It's my theory that DFV and many big traders used this signal as a confirmation to buy Gamestop last summer, it rarely gives a signal so when it happens it's huge.
|
||||
|
||||
it gave a signal *last month !!!!!!!* , usually it takes a few weeks to breakout add a few more weeks for volatility to reach a peak. *As we know volatility is key for us*. We broke out!!!! SO.. in a few weeks we will MOST LIKELY SEE a HUGE SPIKE in volatility A.K.A TENDIES. 🍗🍗🍗🍗
|
||||
|
||||
[](https://preview.redd.it/5kjh4l0bj2971.png?width=571&format=png&auto=webp&s=5e5d94f3a1184deaaf16b96ae9cbab23665db9c1)
|
||||
|
||||
HOLY FUCKING MOLY, this is it. Cherry on top of the sundae :D
|
||||
|
||||
PART 3 : FINAL WORD AND TLDR 🌙
|
||||
|
||||
If you are doubting Techical Analysis let me give you a quote from the book *trading in the zone* by Mark Douglas :
|
||||
|
||||
*'' Individuals develop behavior patterns, and a group of individuals interacting with one another on a consistent basis form collective behavior patterns. These behaviors are observable and quantifiable and they repeat themselves with statistical reliability. -- in a sense technical analysis allow you get into the mind of the market. As a method for projecting future price movement, technical analysis as turned out to be far superior to a purely fundamental approach. '*'
|
||||
|
||||
----
|
||||
|
||||
EVERY INDICATOR IS SCREAMING BUYYYYYYYYYYYYYYYYY
|
||||
|
||||
Like I said in the intro I feel like everything is going as it should right now. If you are anxious or feeling fudy, just know that everything is gearing for a move that is gonna literally break the space-time continuum. 🚀
|
||||
|
||||
Everything is a buy right now, EVERYTHING. We're past the point (I THINK) where we'll ever get GME at a cheap price . Buy if you can HODL if you can't.
|
||||
|
||||
If I could go back in time and tell my past self to buy more at 40$ trust I would but I won't have the regret of not going all in at 200$ , I just maxed out.
|
||||
|
||||
XX hodler till infinity. 🚀
|
||||
|
||||
I will see ya'll on the moon very soon. 🚀
|
||||
|
||||
~~SHILLS BTFOD~~
|
||||
|
||||
❤️\
|
||||
EGGS out -
|
||||
|
||||
*EDIT : I want to thank everyone from the bottom of my heart 💖* *X to XXXX hodlers* *for all the work you guys have put in to build-up this amazing community.*
|
||||
@ -0,0 +1,80 @@
|
||||
A European Footprint. After reading "The Sun Never Sets On Citadel -- Part 1", I looked for a footprint in Germany.
|
||||
===================================================================================================================
|
||||
|
||||
| Author | Source |
|
||||
| :-------------: |:-------------:|
|
||||
| [u/LNhamburg](https://www.reddit.com/user/LNhamburg/) | [Reddit](https://www.reddit.com/r/Superstonk/comments/o3c7ar/a_european_footprint_after_reading_the_sun_never/) |
|
||||
|
||||
---
|
||||
|
||||
[DD 👨🔬](https://www.reddit.com/r/Superstonk/search?q=flair_name%3A%22DD%20%F0%9F%91%A8%E2%80%8D%F0%9F%94%AC%22&restrict_sr=1)
|
||||
|
||||
Inspired by [u/swede_child_of_mine](https://www.reddit.com/u/swede_child_of_mine/)'s DD "The Sun Never Sets On Citadel -- Part 1" I digged into this. Finding a footprint in Germany. (DD-Link: <https://www.reddit.com/r/Superstonk/comments/o2xz48/the_sun_never_sets_on_citadel_part_1/>)
|
||||
|
||||
It's just a footprint.
|
||||
|
||||
The following are not my words. They are quotes from the linked sources. I don't add my own opinion and I'm not a financial advisor. I am just doing a brief summary of the source timeline in my own words.
|
||||
|
||||
TLDR: Source Timeline
|
||||
|
||||
- 2007: Berlin Stock Exchange took a majority stake in EASDAQ NV, which operated under the name EQUIDUCT
|
||||
|
||||
- 2009: EQUIDUCT enters into strategic partnership with Citadel Securities
|
||||
|
||||
- 2012: EASDAQ adds four new members to board (3 from Citadel)
|
||||
|
||||
- 2019: Tradegate takes over Berlin Stock Exchange
|
||||
|
||||
- Tradegate is majority owned by Berliner Effektengesellschaft AG. 90 percent price increase since November 2020
|
||||
|
||||
Sources:
|
||||
|
||||
> Berlin Stock Exchange took a majority stake in EASDAQ NV, which operated under the name Equiduct, in September 2007. The goal for the deal was to offer the exchange's customers a wide range of European financial products.
|
||||
>
|
||||
> Source (English): <http://www.marketswiki.com/wiki/Equiduct_Systems_Ltd>
|
||||
>
|
||||
> 2009: Equiduct enters into strategic partnership with Citadel Securities
|
||||
|
||||
> The Citadel Securities platform includes investment banking, multi-asset class market making, order execution services and Citadel Solutions, a leading hedge fund management company. Securities market making, investment banking and securities trading execution services are provided in the US by Citadel Securities L.L.C., a member of FINRA, and in Europe by Citadel Derivatives Group (Europe) Limited, regulated by the UK FSA. (translated from German Language)
|
||||
>
|
||||
> Source (German language, please use translator): <https://www.pressebox.de/inaktiv/boerse-berlin-ag/Equiduct-geht-strategische-Partnerschaft-mit-Citadel-Securities-ein/boxid/277846>
|
||||
>
|
||||
> The agreement between Citadel Securities and Börse Berlin AG will provide funding to Equiduct for developing its platform into one of Europe's leading execution venues.
|
||||
>
|
||||
> Source (English): <https://www.jugendchor-speuz.ch/docs/ba4883-b%C3%B6rse-berlin-live>
|
||||
>
|
||||
> 2012: Easdaq adds four new members to board
|
||||
>
|
||||
> Easdaq N.V., owner of the pan European retail trading platform Equiduct, today announced the addition of four new members to its board.
|
||||
>
|
||||
> The new board members include Jonathan Graham, Managing Director at Citadel LLC; Jamil Nazarali, Senior Managing Director at Citadel LLC; Daniel Pouget, Entrepreneur in Residence at INSEAD and Peter Randall, CEO of Equiduct Systems Limited.
|
||||
>
|
||||
> Source (English): <https://www.finextra.com/pressarticle/43272/easdaq-adds-four-new-members-to-board>
|
||||
|
||||
> 2019: Tradegate takes over Berlin Stock Exchange
|
||||
>
|
||||
> The trading platform Tradegate Exchange, which specializes in private investors, is being taken over the Berlin Stock Exchange. The company, which is also based in the capital, will in future control 100 percent of the shares in Berliner Börse AG, as both announced on October 9, 2019.
|
||||
>
|
||||
> Source (German language, please use translator): <https://www.berlin.de/wirtschaft/nachrichten/5934420-3912379-tradegate-uebernimmt-berliner-boerse.html>
|
||||
>
|
||||
> Announcement according to Art. 5 subsection 2 of the German Exchange Act: Tradegate Exchange GmbH is the sole owner of Börse Berlin AG.
|
||||
>
|
||||
> Equiduct Trading serves as the full electronic trading platform of Börse Berlin and is technically provided by Equiduct Systems Limited, a company registered in England and Wales (registered number 02937847) whose registered office is 50 St Mary Axe, London, EC3A 8FR.
|
||||
>
|
||||
> Source (English): <https://www.equiduct.com/imprint>
|
||||
>
|
||||
> The Tradegate Exchange is a securities exchange specialized for private investors. Currently, around 30 trading participants from Germany, Austria and Great Britain are directly or indirectly connected.
|
||||
>
|
||||
> Source (English): <https://www.deutsche-boerse-cash-market.com/dbcm-en/secondary-market/tradegate-exchange>
|
||||
>
|
||||
> Berliner Effektengesellschaft: What a story
|
||||
>
|
||||
> The shares of the Berliner Effektengesellschaft (BEG) are among the price miracles of the current bull market that are not quite as in the limelight as Lang & Schwarz or even flatexDEGIRO. Nevertheless: 90 percent price increase since November 2020 alone and a stock market value of around 935 million euros is more than impressive. The investment story is quickly told: The Berliners hold 56.2 percent of the Tradegate trading platform, in which Deutsche Börse AG is also involved. The number of securities transactions processed via Tradegate is currently soaring upwards that nobody would have thought possible. (translated from German Language)
|
||||
>
|
||||
> Source (German Language, please use translator): <https://boersengefluester.de/berliner-effektengesellschaft-was-fur-eine-story/>
|
||||
|
||||
[](https://preview.redd.it/8a12jdq2x6671.png?width=630&format=png&auto=webp&s=e7bb188fd54a7f0f44c7bfb3efbbd6466fda0e9f)
|
||||
|
||||
Screenshot from Link above.
|
||||
|
||||
Edit: Writing
|
||||
12
Timeline/2021-06-28-GME-Timeline-Closing-Price-vs-Date.md
Normal file
12
Timeline/2021-06-28-GME-Timeline-Closing-Price-vs-Date.md
Normal file
@ -0,0 +1,12 @@
|
||||
6/28: GME Timeline of Closing Price vs. Date
|
||||
============================================
|
||||
|
||||
| Author | Source |
|
||||
| :-------------: |:-------------:|
|
||||
| [u/PWNWTFBBQ](https://www.reddit.com/user/PWNWTFBBQ/) | [Reddit](https://www.reddit.com/r/DDintoGME/comments/o9td0p/628_gme_timeline_of_closing_price_vs_date/) |
|
||||
|
||||
---
|
||||
|
||||
[𝗗𝗮𝘁𝗮](https://www.reddit.com/r/DDintoGME/search?q=flair_name%3A%22%F0%9D%97%97%F0%9D%97%AE%F0%9D%98%81%F0%9D%97%AE%22&restrict_sr=1)
|
||||
|
||||
[](https://i.redd.it/o8qkbzkcm2871.png)
|
||||
Reference in New Issue
Block a user